


Navigating No Man’s Land
Uncharted 47

Dear Subscribers,
As we see bitcoin continue to range at depressed levels, we question whether this could be a new prolonged range, similar to the prior $29k-$30k range, or whether a move is about to occur.
In this Uncharted:
We looked at mixed signals from the various crypto indicators regarding the directionality of the next move and work to make sense of them.
We explore how the macro side might affect the delicate balance we currently see in crypto, particularly in the ranging bitcoin.
We outline one risky altcoin strategy that could be played in the current market conditions, while bitcoin remains in the current range (see ‘Zooming in’ section).
Let’s dive in!

State of the System
Bitcoin is in no man's land, with no clear sign of direction in the short term. The price is trading within a narrow range, and there is no strong momentum in either direction. We remain within the bearish quadrant, depicting an unstable environment. The volatility in the last three weeks presented the State of the System to the bearish quadrant. Despite the current bearish sentiment, there are some signs that the bearish momentum is fading. This uncertainty is also evident in liquidity pools, with potential pain for long positions below $25.5k and short squeezes possible above $26k. These moves should be viewed cautiously, as they may not necessarily lead to breakouts.

In Uncharted 46 two weeks ago, we stated that holding $26k level is key. BTC has slid above and below $26k multiple times sice then and has found liquidity in the $25.3k area, which is still an area of interest and liquidity in the short term. The price is currently trading below $26.8k, which is a key resistance level. If the price breaks above this level, it could signal a change in trend and even lead to a rally. The nearest and biggest liquidity pools are below $24k and to the upside above $27k.
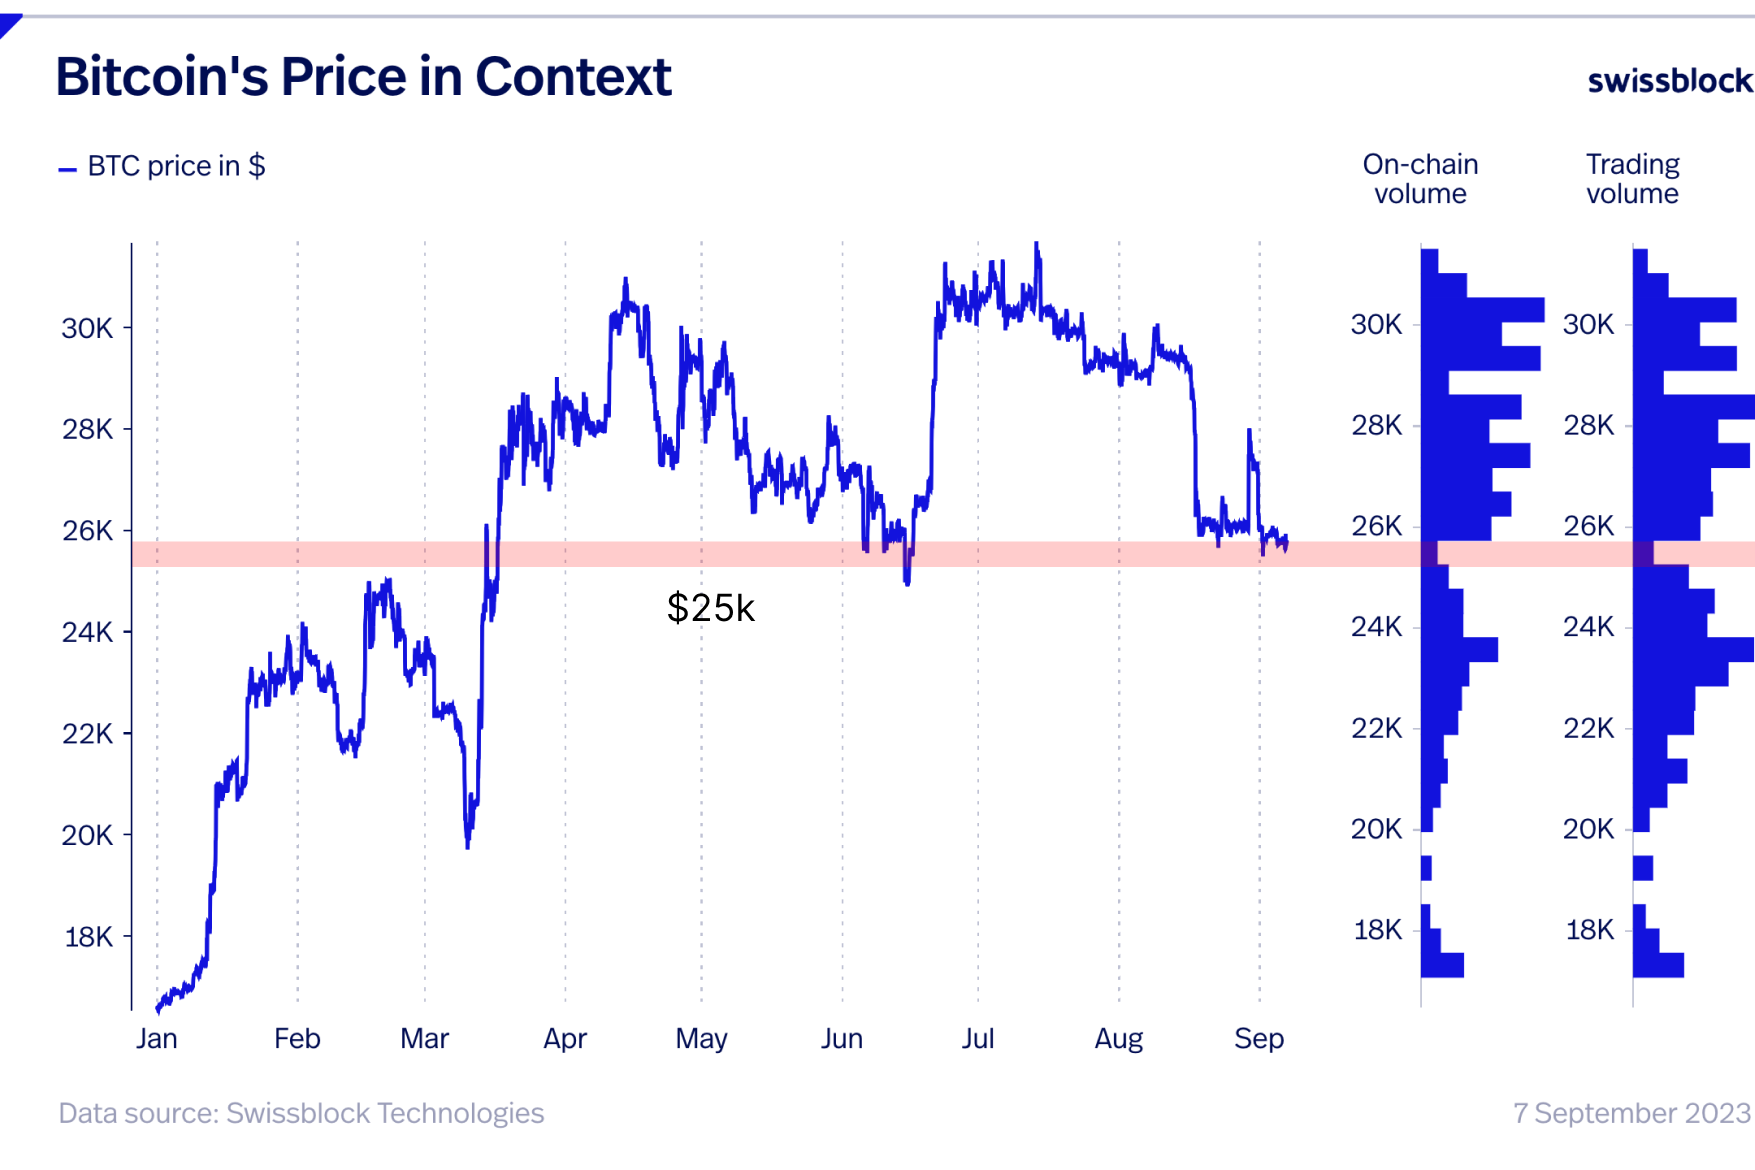
The current ranging at this lower level echoes the prolonged $29k-$30k range we saw before the price plummeted below $25k, and one thing's for certain: we're setting up for another move. It's like Heraclitus said: "No man ever steps into the same river twice". We’re not in the same range, and we’re not playing by the same rules we played in the $29k-$30k range, where we spent a full month, from mid-July until mid-August, before the drop occurred.
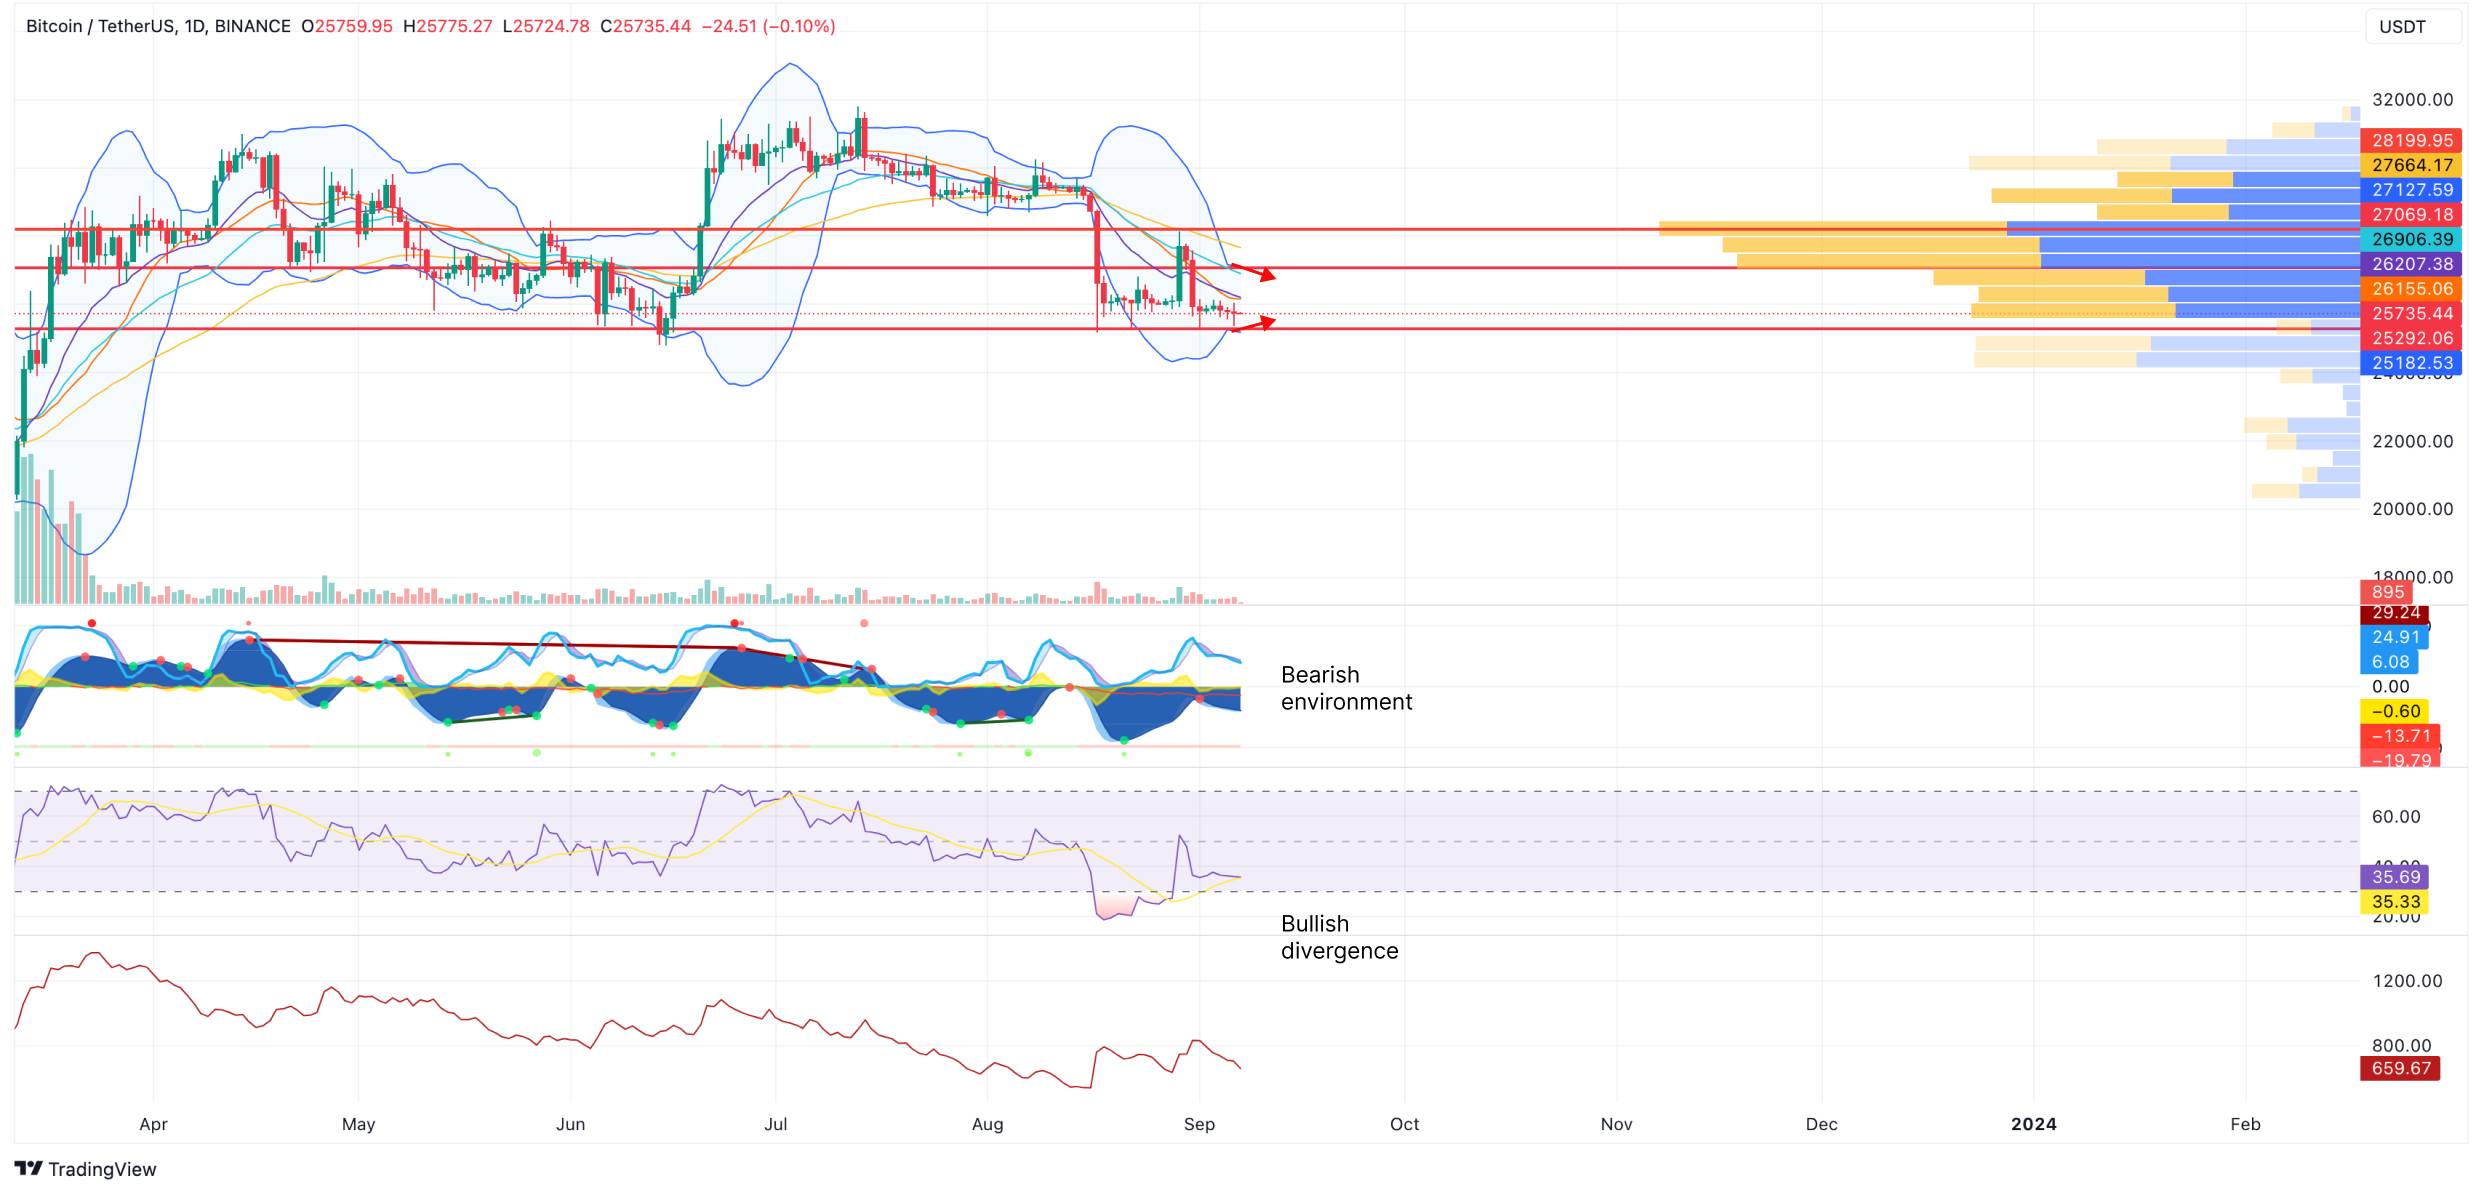
Bollinger bands are getting tighter, suggesting that we will continue to consolidate until the short-term level breaks ($25.5k- $26.2k). Once this range breaks, volatility should pick up and we'll be off to the next range.
The Cipher B indicator (second chart from top to bottom), depicts the bearish environment we’re into and hasn’t flashed any buy signal. However, the RSI (third chart from top to bottom) is forming a bullish divergence, which could trigger another leg up. It's best to wait for the next move and react when these mixed signals resolve.
Keep reading with a 7-day free trial
Subscribe to Swissblock Insights to keep reading this post and get 7 days of free access to the full post archives.