


There’s Always a Silver Lining
Uncharted 46

Dear Subscribers,
After the recent crash, which went hand in hand with a return to the bearish regime in our indicators, we now look at the opportunities ahead.
In this Uncharted:
We examine hurdles for bitcoin to reclaim its recent $29k+ level and beyond.
We analyze potential tailwinds for risk-on assets from the macro side.
We look at unique opportunities in altcoins, sharing some exciting projects to look at in this environment (a layer 1 and a layer 2 project).
Let’s dive in!

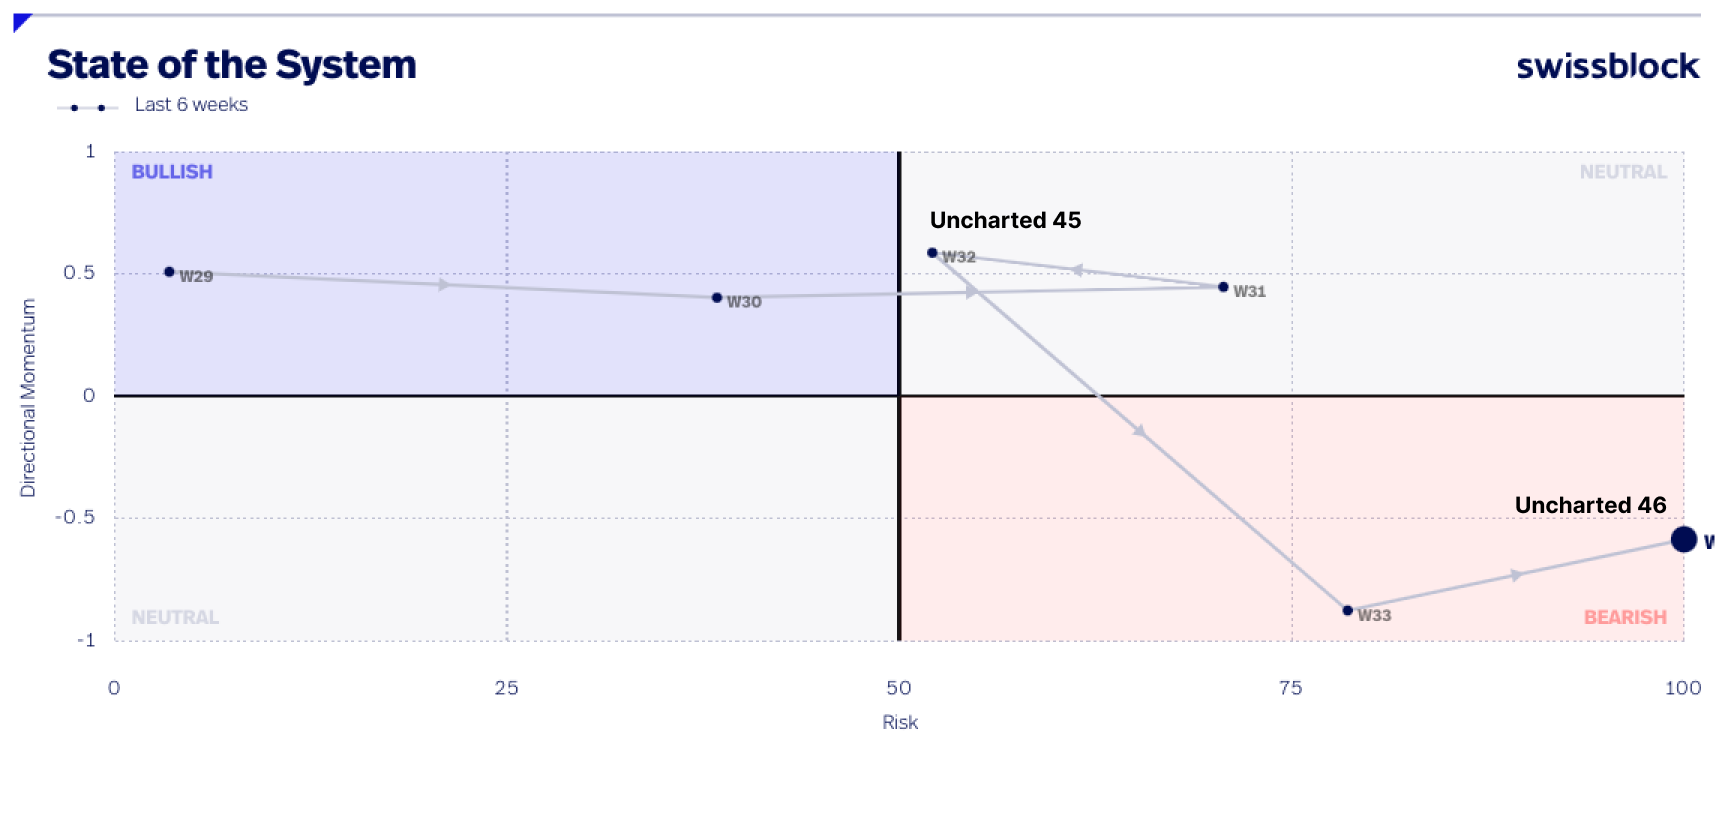
State of the System
Let’s recap where we left off in Uncharted 45, from August 11th. In an environment of a neutral State of the System and a low volatility fluctuation around the $29.5k mark, we posed the central question: “We explore the calm before the storm in bitcoin price: Will the spike in volatility we are moving towards be to the upside or the downside?”
Now we know the answer to that question: The shock in volatility happened (way) to the downside, and we witnessed one of the most pronounced drops in bitcoin’s history, with over $1bn in liquidations in just 24 hours. It was a significant reset clearly reflected in the State of the System (figure 1).
Holding $26k is key in the coming days. Losing it would likely mean another test of the $24.8k - $25k psychological level. Notice how liquidity diminishes below $26k until the high $24k level (figure 2). The first step is to hold over $26.3k, retest the $26.7k level, and hope that bulls will drive the price over $27k. An upward-trending spot CVD would be a key indicator that a move toward the upside carries the weight needed for continued positive momentum.

Figure 3 shows how the RSI (third chart from top to bottom) is at levels not seen since the Covid-19 (March 2020) crash despite the bearish trend. Along these lines, the Cipher B signal on the 4-hour candles (second chart from top to bottom) has been shooting buy signals (depicted by the green dots). While we might see one last test of the high 24k and low 25k level, the price action points towards a mean reversion towards $27.5k in the short term.
Keep reading with a 7-day free trial
Subscribe to Swissblock Insights to keep reading this post and get 7 days of free access to the full post archives.