Dear Glassnode Friends,
With regards to the current Bitcoin cycle, not much has structurally changed since our last update, and the concepts covered still hold true. We’ll send out an update once we think we have reached the next stage.
As mentioned last time, we believe that one of the major things that could derail Bitcoin of its current trajectory are dynamics that come from the outside global macro environment. This is why we would like to explore a more macro focused perspective in this Uncharted.
From an institutional investor’s viewpoint, the 2 primary investment thesis for Bitcoin are its value as an inflation hedge, and its value as a technology play.
Today we’ll explore Bitcoin’s inflation hedging properties and why they are currently dominating the prevailing narrative.
For any questions please contact us directly on twitter or uncharted@glassnode.com.
To start off with, Bitcoin’s correction in the last couple of days was simply caused by a general downturn in equities. This was partially due to the quarterly rebalancing of institutional investors, increased uncertainty regarding Brazil’s new covid variant, and interest rates that are still on the rise.
So let’s dive into some dominant macro dynamics.
Until 2020, Bitcoin’s performance was largely uncoupled from the performance of global financial markets in general. But as institutional money has started to pile into the crypto space, we can no longer disregard the narrative and events driving global financial market’s. Since early 2020 – kickstarted to a degree by the Covid pandemic – BTC markets have undergone somewhat of a regime shift. Take for example the intraday correlation between BTC and the S&P500.
While the intra-day BTC-S&P500 correlation hovered around 0 prior to March 2020, we calculate the mean intra-day correlation to be 0.25 since then. This drastic shift in correlation pattern is primarily driven by the increasingly overlapping investor base of crypto and equity markets. To get the full picture of what drives crypto investment flows it is therefore no longer enough to view BTC as an isolated asset class.
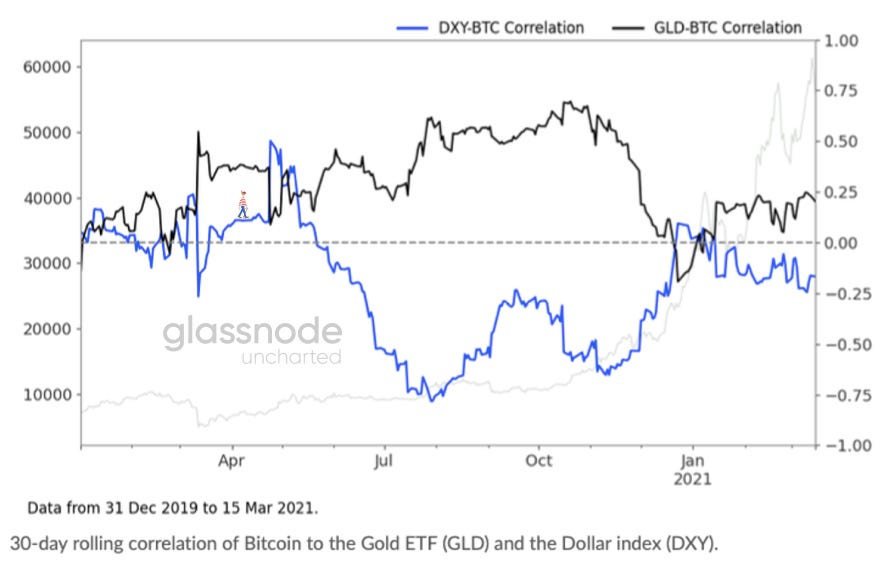
We can observe that from a 30d rolling correlation between Bitcoin and the S&P500 we have now reached levels last seen in October and March of 2020, whilst other correlations with gold, bonds, and the dollar index (DXY) have actually decreased significantly.
An important question to take into consideration when looking at the future performance of the stock market and Bitcoin, is what will happen to inflation.
Since the onset of Covid, global financial market performance has been driven by the pandemic and its fallout. To mitigate the adverse effects of shutting down large parts of the economy, governments and central banks have embarked on a path of unprecedented monetary and fiscal stimulus.
With this excess printing, Bitcoin is already challenging gold as the investor’s choice for an ideal inflation hedge. Net fund flows in the largest gold ETF for example have been negative, with gold outflows totaling -6.8bn USD. Meanwhile in 2020, in Greyscale’s BTC trust alone, inflows outpaced the amount of newly mined Bitcoins in Q4 by 200%.
Short term inflation expectations have been rising strongly over the past few months and Bitcoin has benefited accordingly. To gauge whether inflation hedging flows will continue to boost Bitcoin in the near future, we need to take a close look at what drives inflation (and inflation expectations) in the first place.
The Fed’s monetary policy has led the money supply to skyrocket. M2 (the sum of total coins and notes in circulation, cash equivalents, short-term time deposits and money market funds) has increased to levels last seen during WW2.
Meanwhile, the total federal debt as a percentage of GDP is the highest on record and that’s without taking into account the 1.9tn USD fiscal package that Congress passed this month.
Money supply has ballooned, public debt has ballooned and yet inflation hasn’t really budged: the latest year-on-year inflation figure comes in at 1.6%, still well below the FED’s targeted 2%.
Whether this state of affairs can continue is the million dollar question. Bond and equity markets do not seem to think so. Over the past few months increasing inflation expectations have been shaping both bond returns (driving up yields) and equity returns (rotating from growth towards value stocks). We will delve more into both effects further on.
So how and when does inflation materialize? To answer this, we start off with the famous equation of exchange. It simply states that the nominal output of an economy (real output times price level) equals the total money supply multiplied by the velocity of money (the average frequency with which a money unit is spent). PQ = MV.
If we solve this equation for the price level P, we see that the changes in price level is an increasing function of changes in money supply (M) and velocity (V). A big increase in money supply unaccompanied by real economic growth will manifest in inflation unless supply fails to circulate. In Covid times, the reason we haven’t seen a marked pick-up in inflation so far is because velocity has tanked due to people not spending.
So why hasn’t all that new money been circulating quickly through the system? Take a look at the personal savings rate in the US. The Covid outbreak and subsequent increase in money supply has coincided with a rapid increase in personal savings. Consumers are afraid, unsure of the future and thus tend to save more short/medium term.
Households have built up a huge additional savings cushion of around 1.3tn USD from which they will be able to draw upon in the future, either to pay down outstanding debt or to invest into financial markets.
Many of those stimulus checks have found their way into online retail brokerage accounts. Brokerage app downloads is a nice proxy to show the increase for this activity.
Other proxies for retail trading volumes paint the same picture. Trade Reporting Facility (TRF) volumes doubled throughout 2020, now making up nearly 30% of total volume. This demand is specifically coming from increased interest in equity options contracts.
What is important to understand, is that savings rate increases during a recession are not particularly surprising in and of itself as households prepare to deal with increased uncertainty. For example, roughly 40% of the increase in savings during the Great Financial Crises (2008) can be attributed to precautionary savings.
What is relevant for the future path of inflation however is whether, as the economies open up again, households course-correct and start to splash that cash again or whether they chose to reduce their debt burden. So far, early evidence suggests the former, with total household debt having increased by 414bn USD to 14.6tn in 2020.
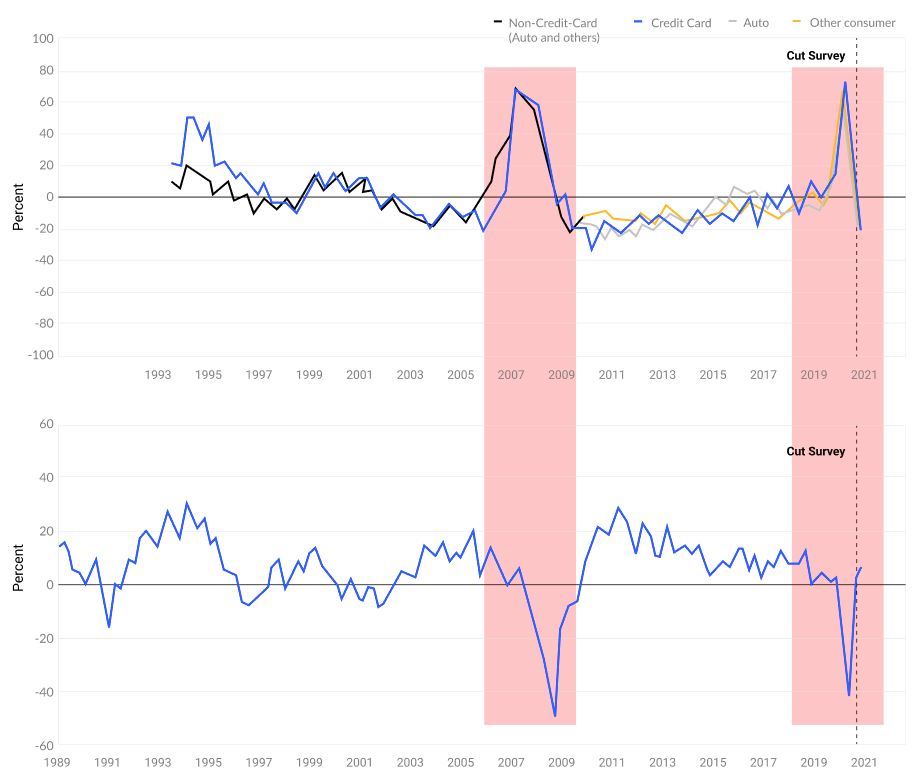
While much of this increase was driven by a lot of people getting more mortgages, the only major category of debt that actually decreased over the time period was credit card debt. We see credit card debt as a proxy to short term spending habits.
Having said all this, we expect that with increasing vaccination rollouts, economies are going to start opening up again and consumers will start spending in summer. The real question is if this will simply be a short spike in velocity or a persistent one. If it is only a short felt spike in inflation over the summer months, the reflation narrative would be in serious trouble and we should be concerned that we will not get a healthy economic recovery anytime soon.
The FED however is not particularly concerned with inflation for the time being. Last week’s Open Market Committee statement reaffirmed the Fed’s laser focus on fighting unemployment, even if it means to spike inflation in the short term.
For years now inflation has been below its target rate of 2%, and in order to kickstart the post-covid recovery, it is willing to let the economy run hot by allowing inflation to temporarily rise.
Thus global markets have begun aggressively pricing in renewed inflation. US 10-year Treasury yields for example have risen from 0.93% at the beginning of the year to 1.64%.
Historically the 10-year yield has been closely linked with money velocity.
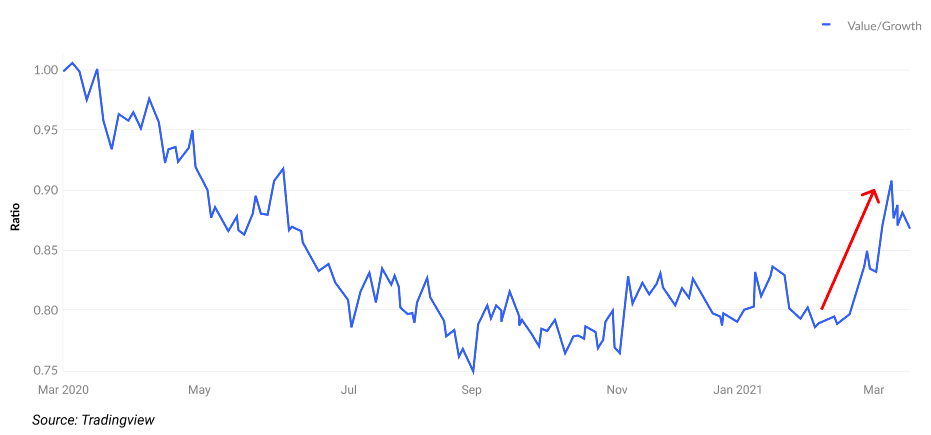
As mentioned earlier, the reflation trade has also played out in equity markets. The rotation in equity markets away from growth (including tech) towards value (including banks) since the turn of the year has been strong.
This happens because, as prices rise, consumers can purchase fewer goods and services without increasing their disposable income. As a consequence, companies revenues and profits decline, meaning that the overall economy slows down, and the ability for high growth companies to continue their fast growth trajectory becomes increasingly more difficult.
So for the first time in a very long while, markets are bracing themselves for a significant rise in inflation. The Fed’s change in focus and policy regime is forcing investors to once again tackle inflation fears, which is great news for Bitcoin!
As BTC investors we should continue to monitor the Fed’s statements on their future policy outlook and should track inflation expectation sensitive economic data, such as the PMIs, for up- and downside surprises to anticipated economic activity.
On our side, we also continue to monitor breakevens and yield spreads for any changes or accelerations in the underlying dynamic and how that can impact Bitcoin.
Remember that the size of the US equity markets alone tops 40tn USD, which is more than 40x the size of BTC.
Even comparatively small allocations away from equities to BTC could have huge price impacts for the digital asset class.
So yes, March is historically thought of as a rather weak month, but what does this mean for Bitcoin’s price development in the coming weeks? Will there still be one more leg up like we suggested in Uncharted#5 after all?
In January, an important factor for the rallying markets were the stimulus payouts.
The recent stimulus package was much larger than the one in January, yet global markets have felt little effects of it in the global markets so far.
It’s difficult to measure to what extent the checks have arrived in households until today, and more importantly how willingly retail is going to spend or save the money this time considering it may be the last monetary stimulus for a while.
The potential investments coming out of household’s saving buffer will be a major factor that might determine the markets’ behavior for the rest of Q2.
Will the March and January cycle’s repeat, where people will invest excess income into the markets, or will this time be different?
We’ll leave it here for today, hopefully these concepts were able to stimulate some alternative perspectives.
Thanks as always, and we hope you enjoy your weekend.


Well explained. Thank you for your hard work. Could you please explain how Options expiry are affecting the crypto market for better understanding? Thank you again.
Great analysis! It is important to look at the crypto markets in the context of the other financial markets.
What the future holds? A cap on the yield curve and a shift towards Modern Monetary Theory? The introduction of stricter regulation (travel rule) could also have an impact on the crypto markets. Not easy but exciting ;-)