


Dear glassnoders, welcome to Bitcoin Uncharted!
As requested by many of you, we have decided to start sharing some observations, which resemble our broader view of the crypto market.
As engineers we specialize in constructing unique metrics from often orthogonal datasets, thus we’ll let our charts do the talking and keep things concise (no TLDR!). Data and graphs will be from studio and our internal R&D division, for definitions of metrics please refer to available metrics on studio or shoot us any questions in the comments.
Although eventually intended for advanced subscribers, we wanted to make this available for anyone that finds it valuable for the time being. We’ll try to get this out to you at least once or twice a month, unless the market demands us to do so more frequently.
We hope these charts can trigger some helpful thoughts as Bitcoin and crypto climb further into uncharted territories.
Let’s dive in!

Factors like Grayscale buying up nearly 260k bitcoins in the second half of 2020 are signs that institutionals have increasingly been the main structural price drivers in Q3 and Q4 of last year. They stopped accumulating on December 24th and just restarted yesterday with 2K BTC.
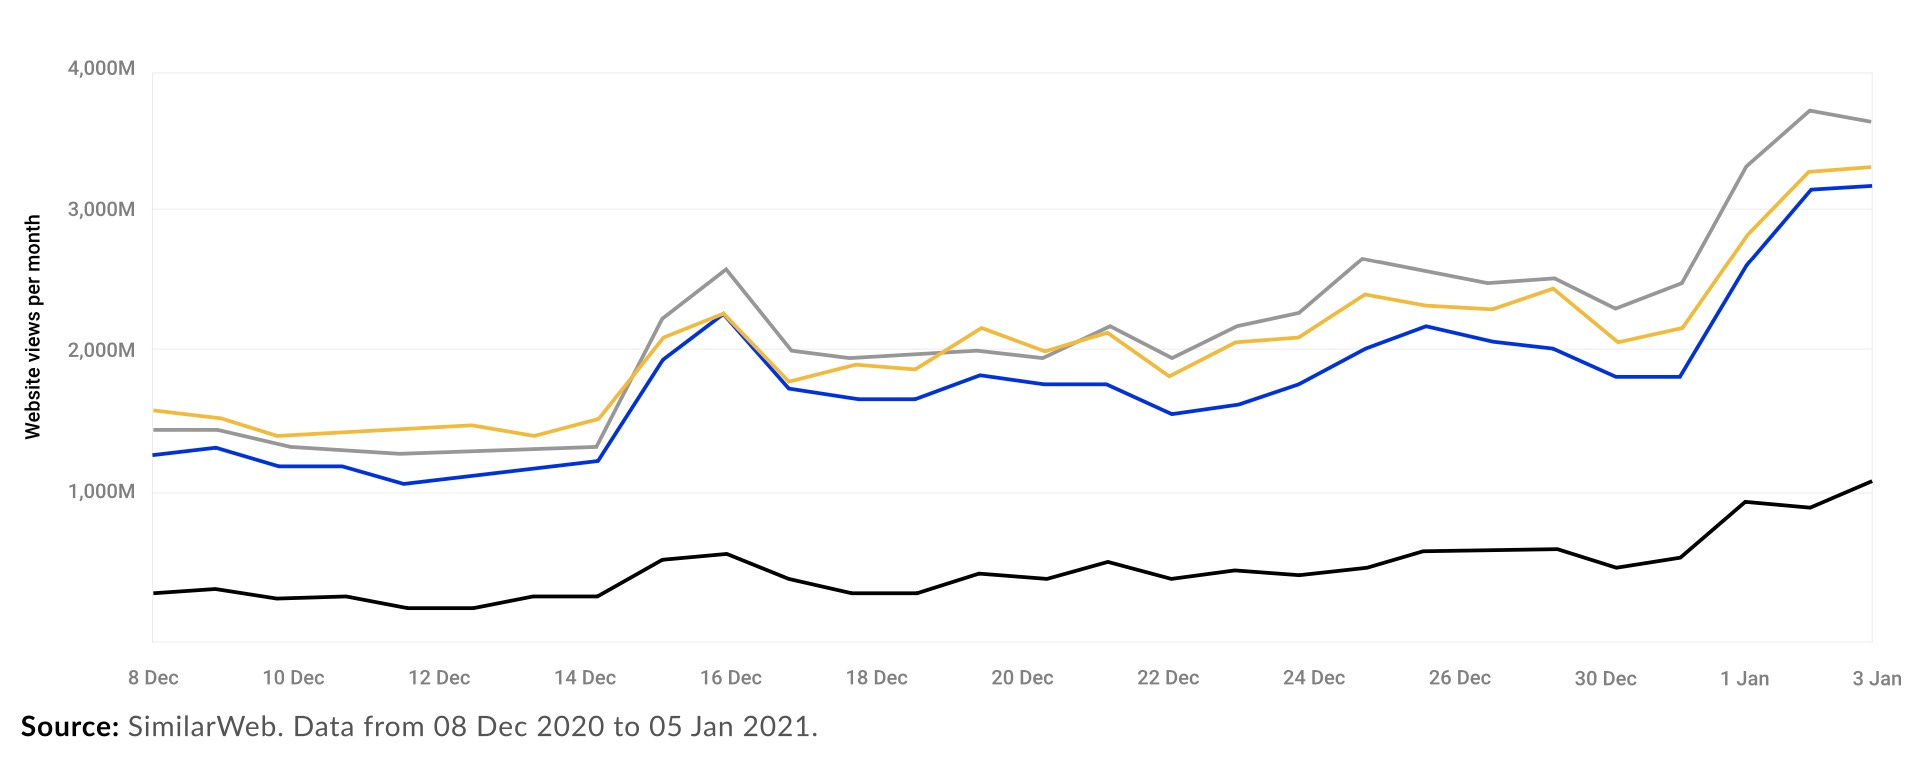
The low volume December holiday rally on the other hand was clearly driven by retail investors, as visits to the top 4 crypto exchanges tripled.
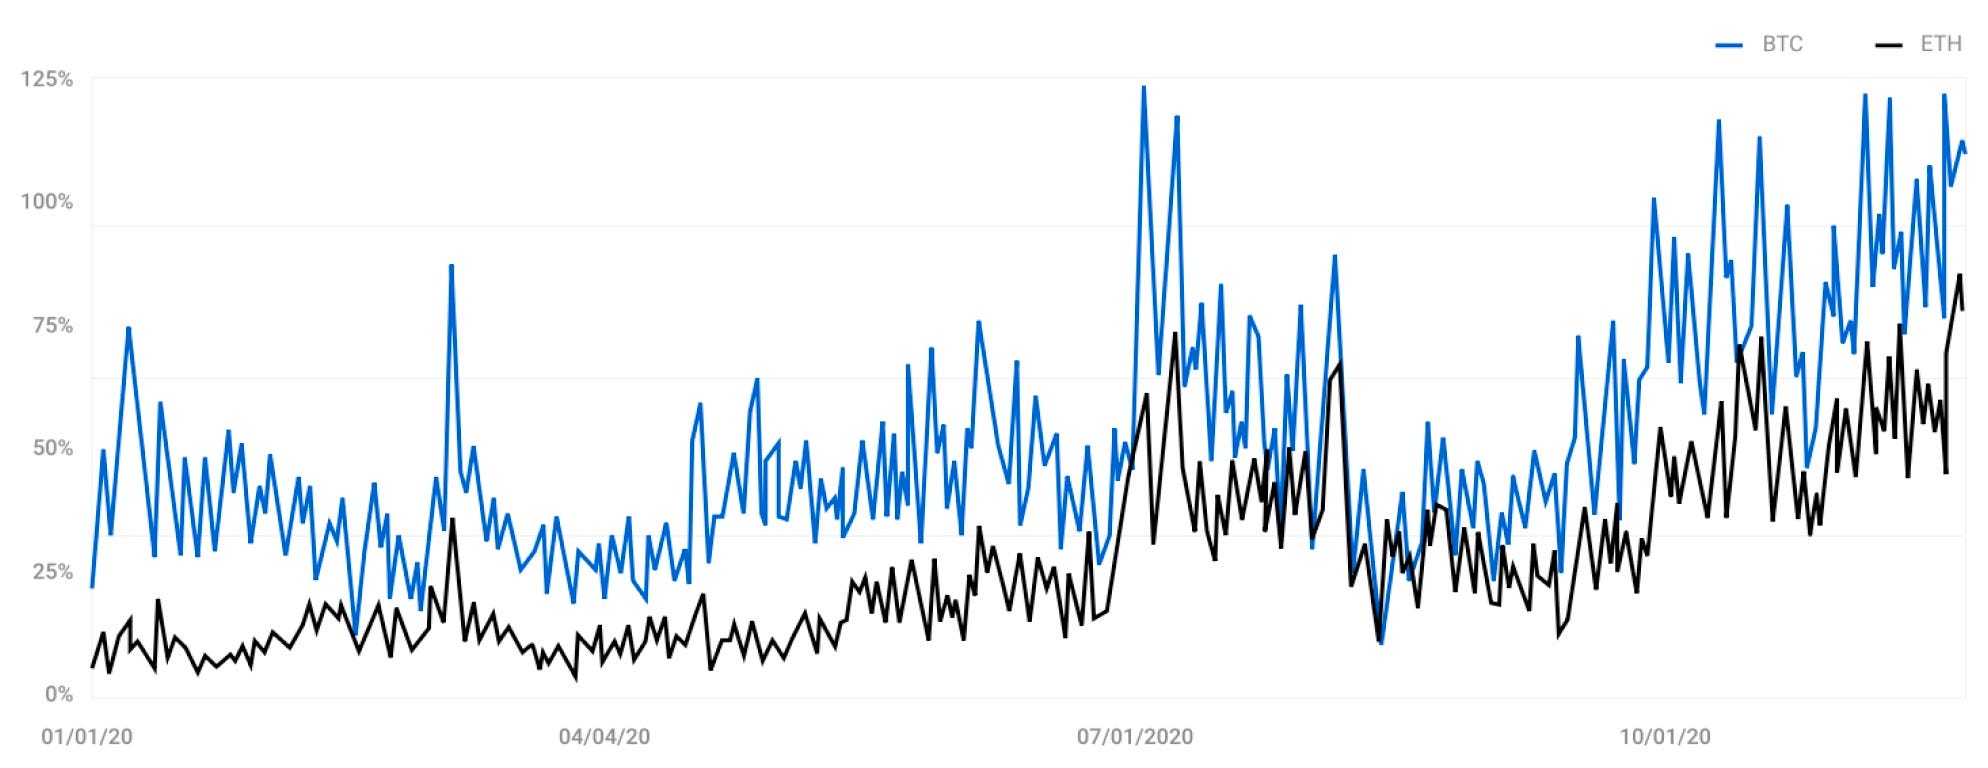
BTC and ETH’s futures vs spot volume ratio has drastically increased throughout the past months, suggesting that the amount of leverage used in the system is now higher than ever. This will change the dynamics of the system quite a bit, as we’ll explore below.
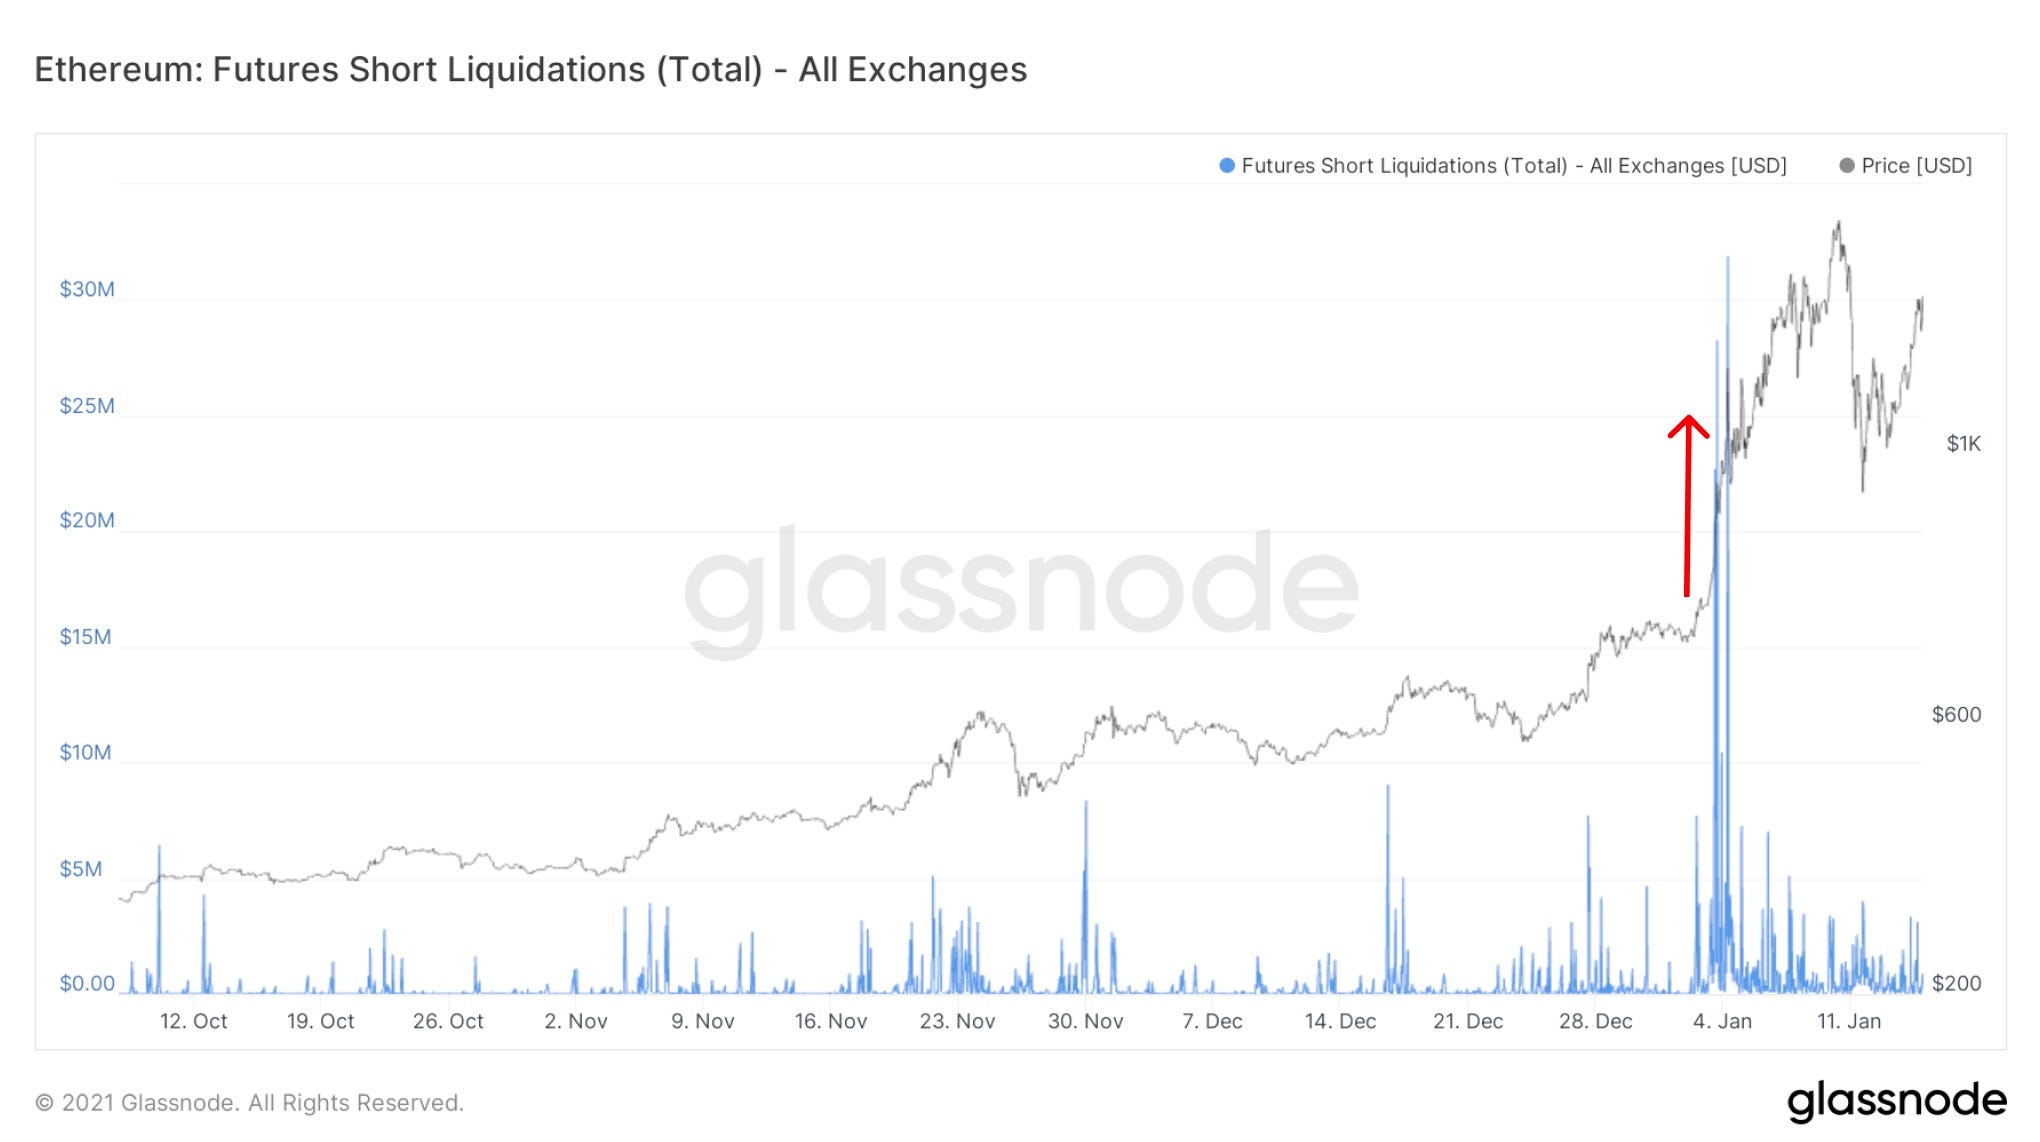
The reason of ETH’s recent squeeze from $750 to $1000 was simply caused by an extensively high number of shorts being liquidated, which would have not happened as easily in a spot dominated environment one year ago.
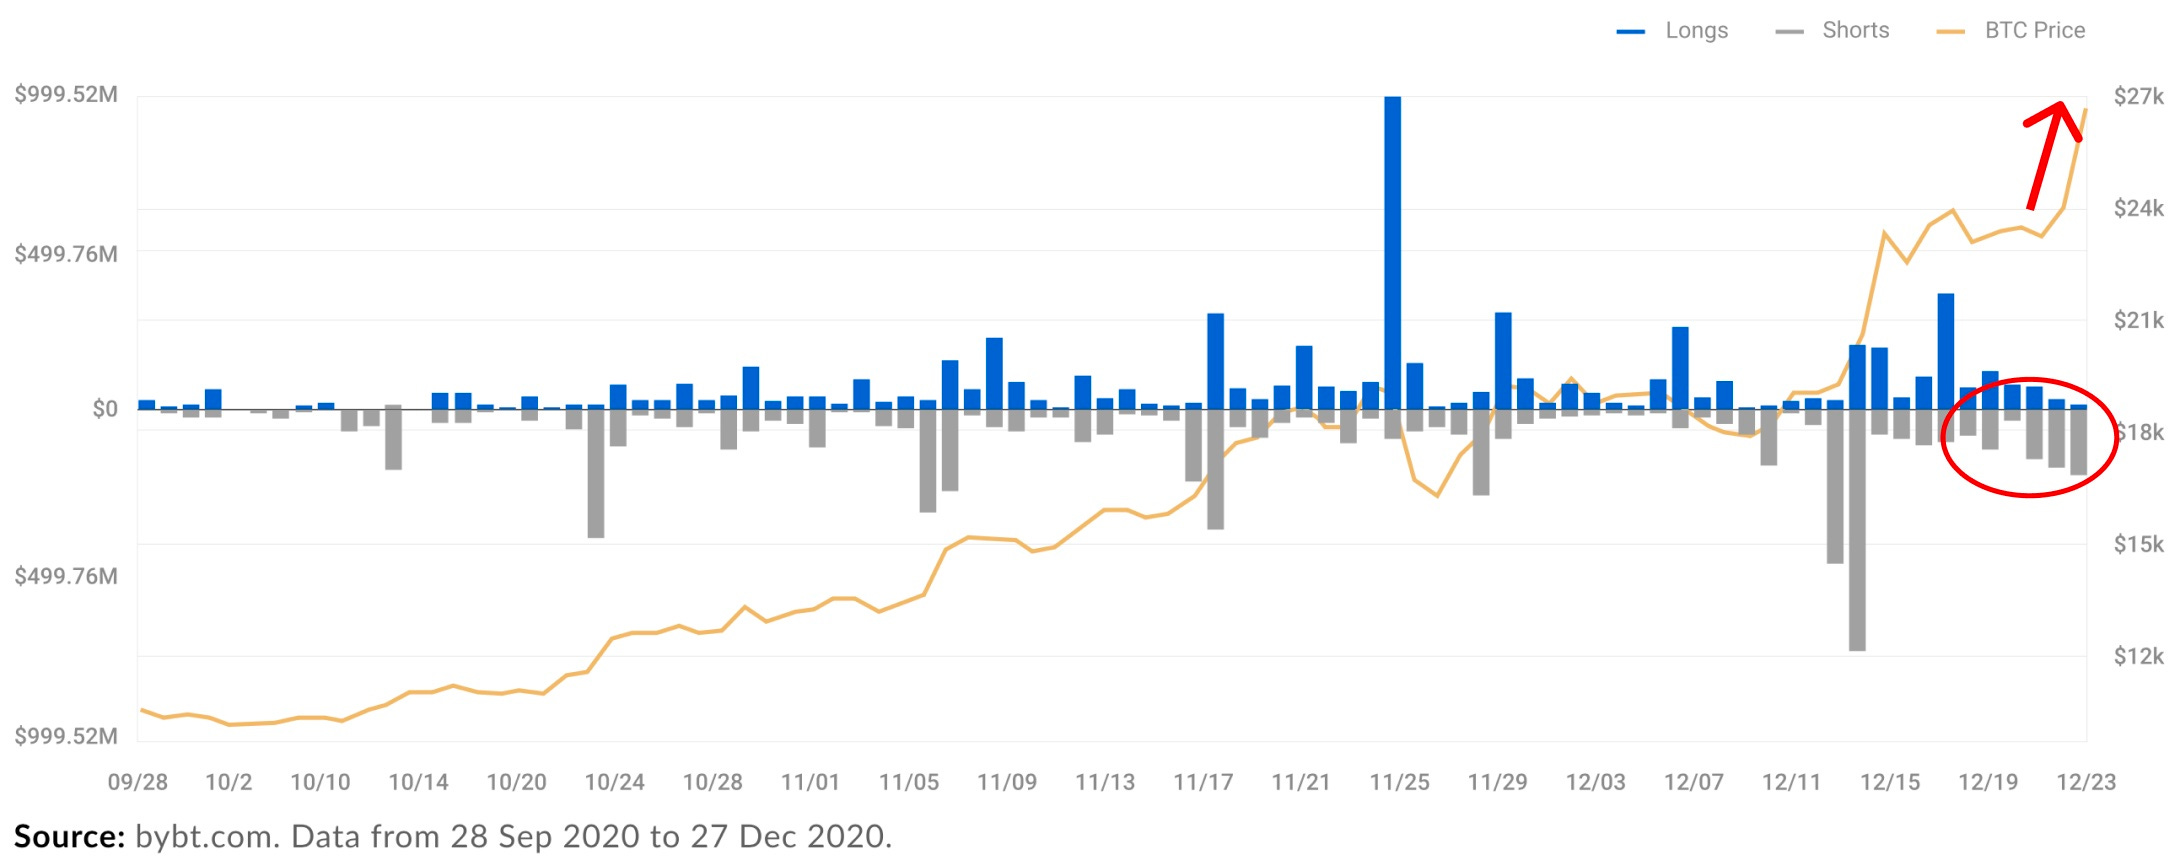
Also BTC short liquidations accelerated the price hike before Christmas quite significantly.
This was even further fueled by the subsequent gamma squeeze that happened in bitcoin options markets during the same time period, resulting in a further melt-up in the market.
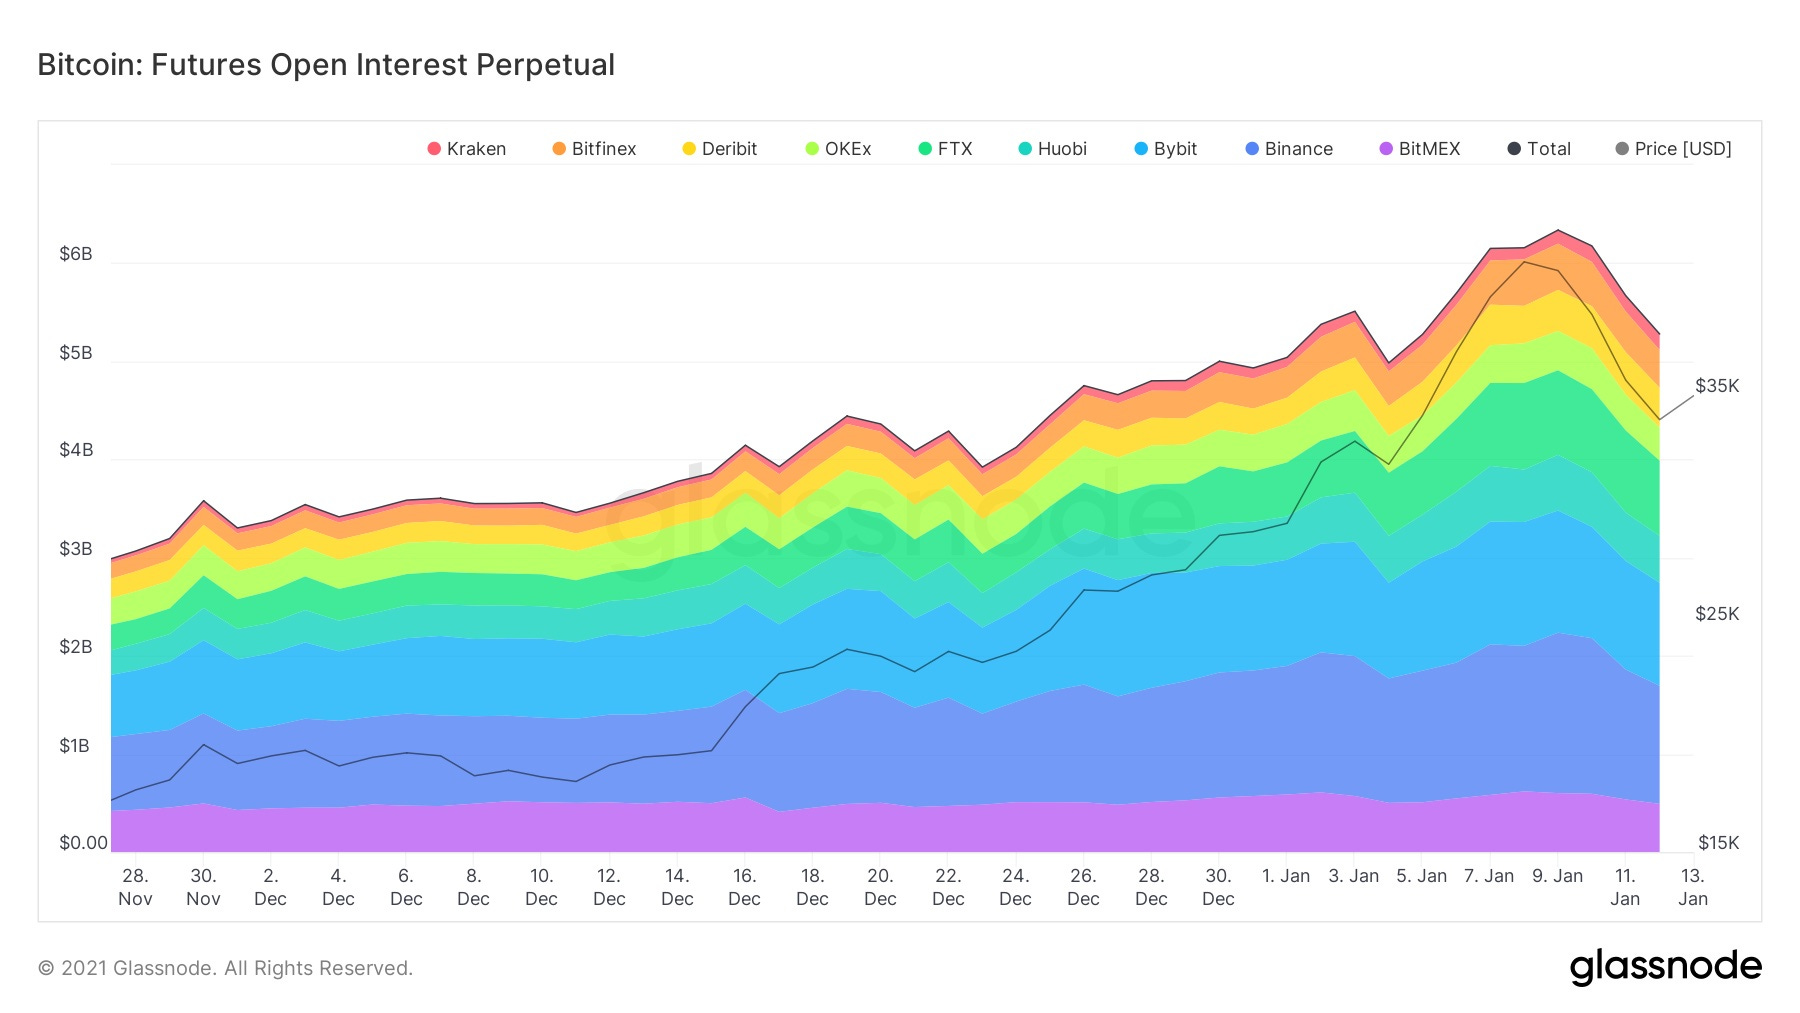
The weakened trend in spot seen last week was nicely signaled by falling open interest, which also acts as a precursor of falling volume. It was a sign that the speed of the rally was approaching its upper limit, and a consolidation was necessary. Less people were willing to add to their exposure showcasing a reduced risk appetite.

As it stands today, although funding rates have cooled off a little on a multi week timeframe, we need to keep an eye on these as persistent elevated numbers can increase the chance for more short term corrections.
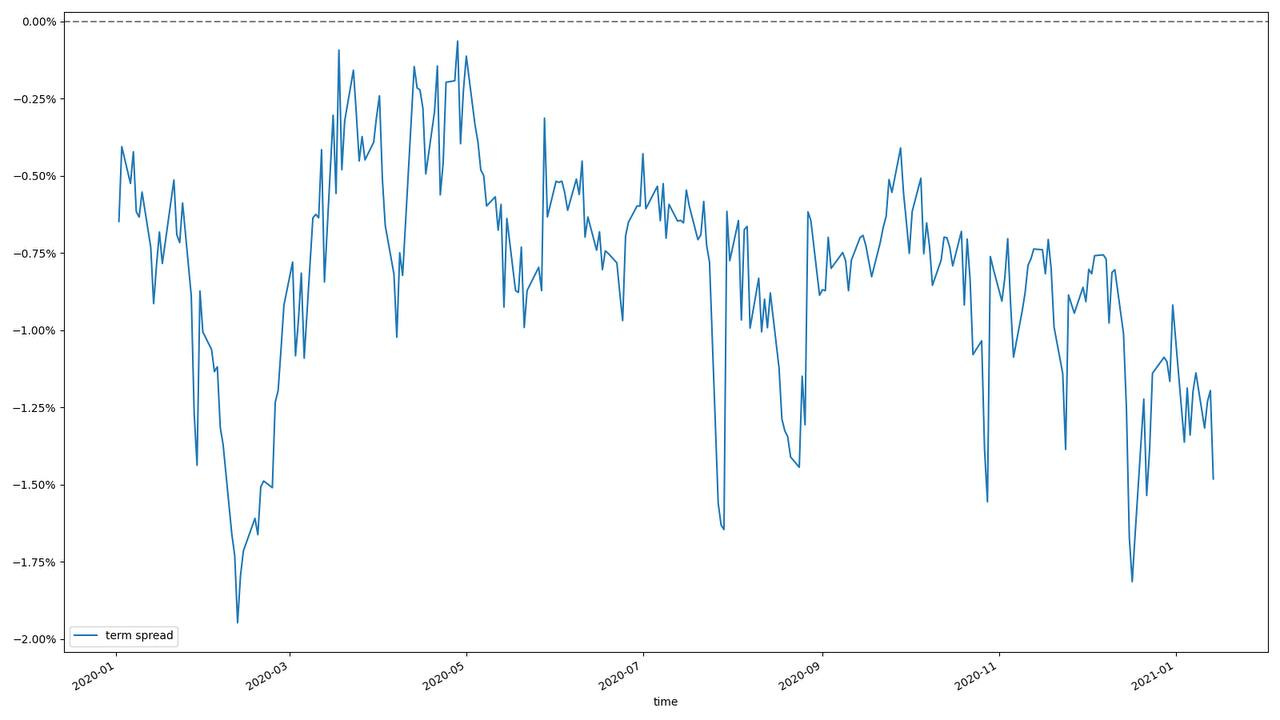
Looking at the CME term spreads, it becomes evident that the term structure is steepening, meaning that the expectation of the future price is higher than the current spot price. Although not to be taken on its own to make decision, this indicates that there are higher expectations that there are further price increases into February. It’s important to keep an eye on this until the number of contracts placed for February options increases.

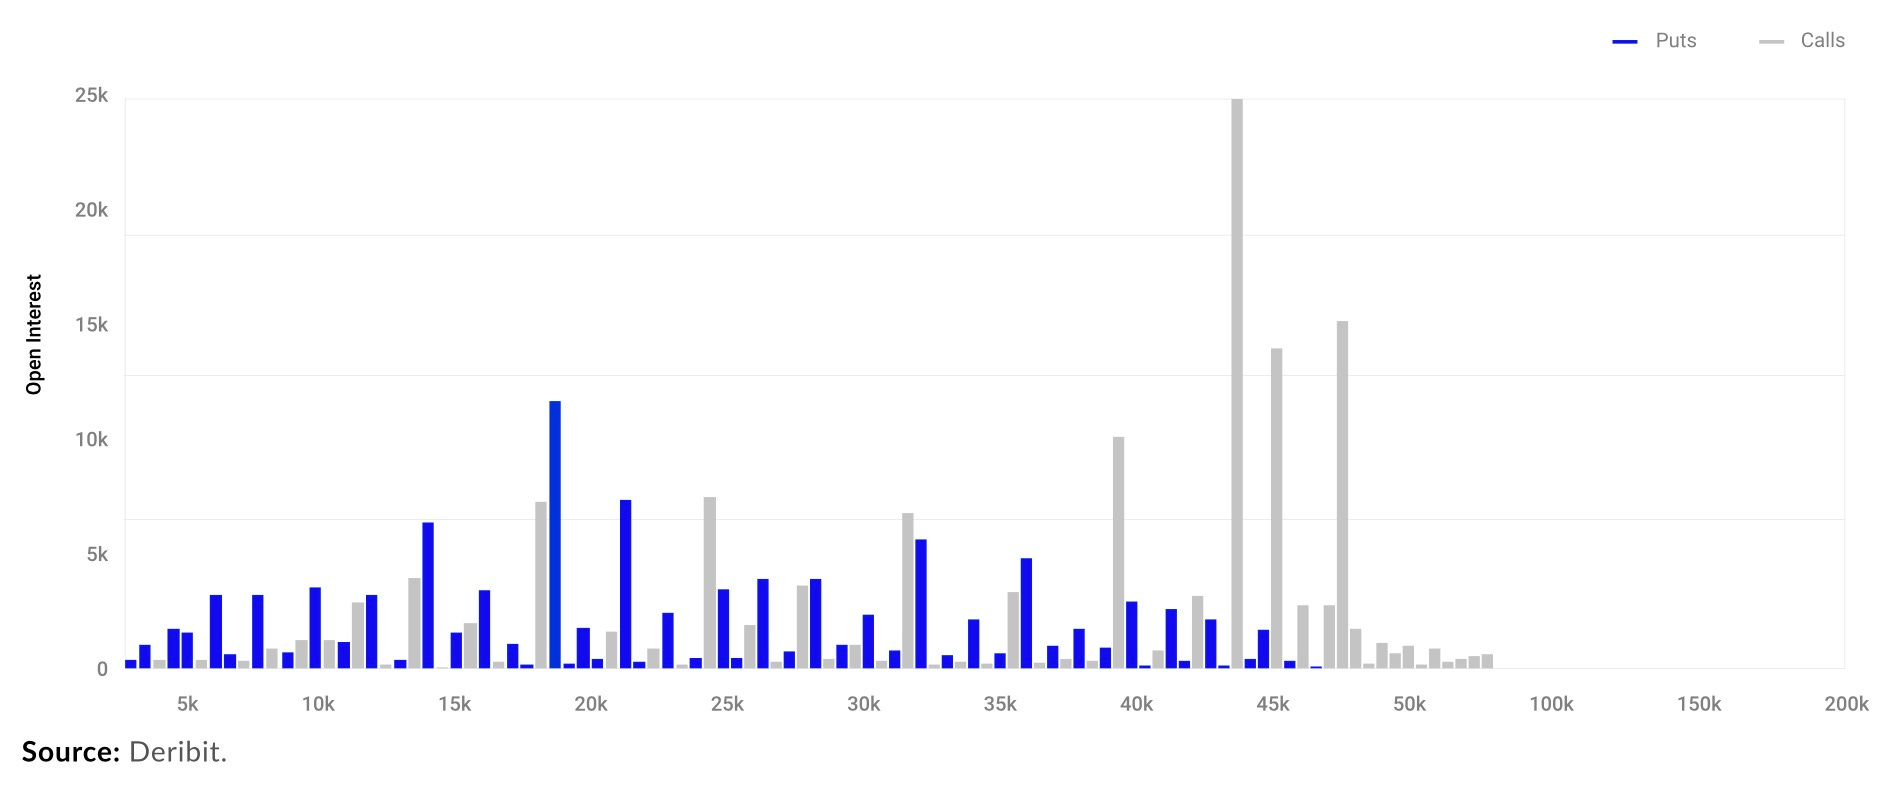
It will be very important to keep an eye on February options to determine where the majority of the strike prices will consolidate to understand if there is a potential for a repeated gamma squeeze like the one we saw in December.
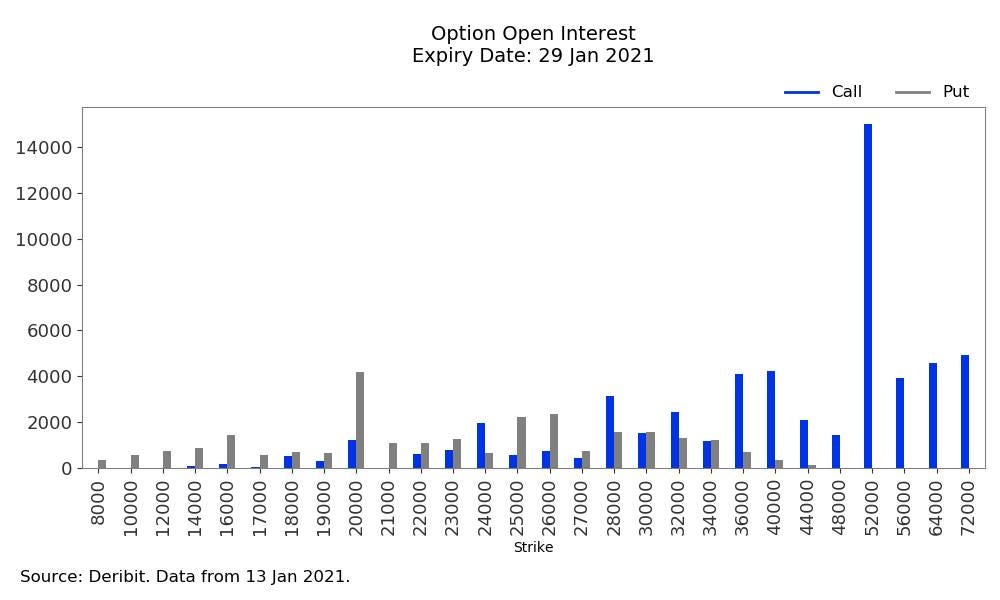
In the next to weeks there seems to still be hope for $50k strikes to be in the money.

Short Term Holder SOPR has also reset after overheating quite a bit and can now act as a good support level for the next leg up.
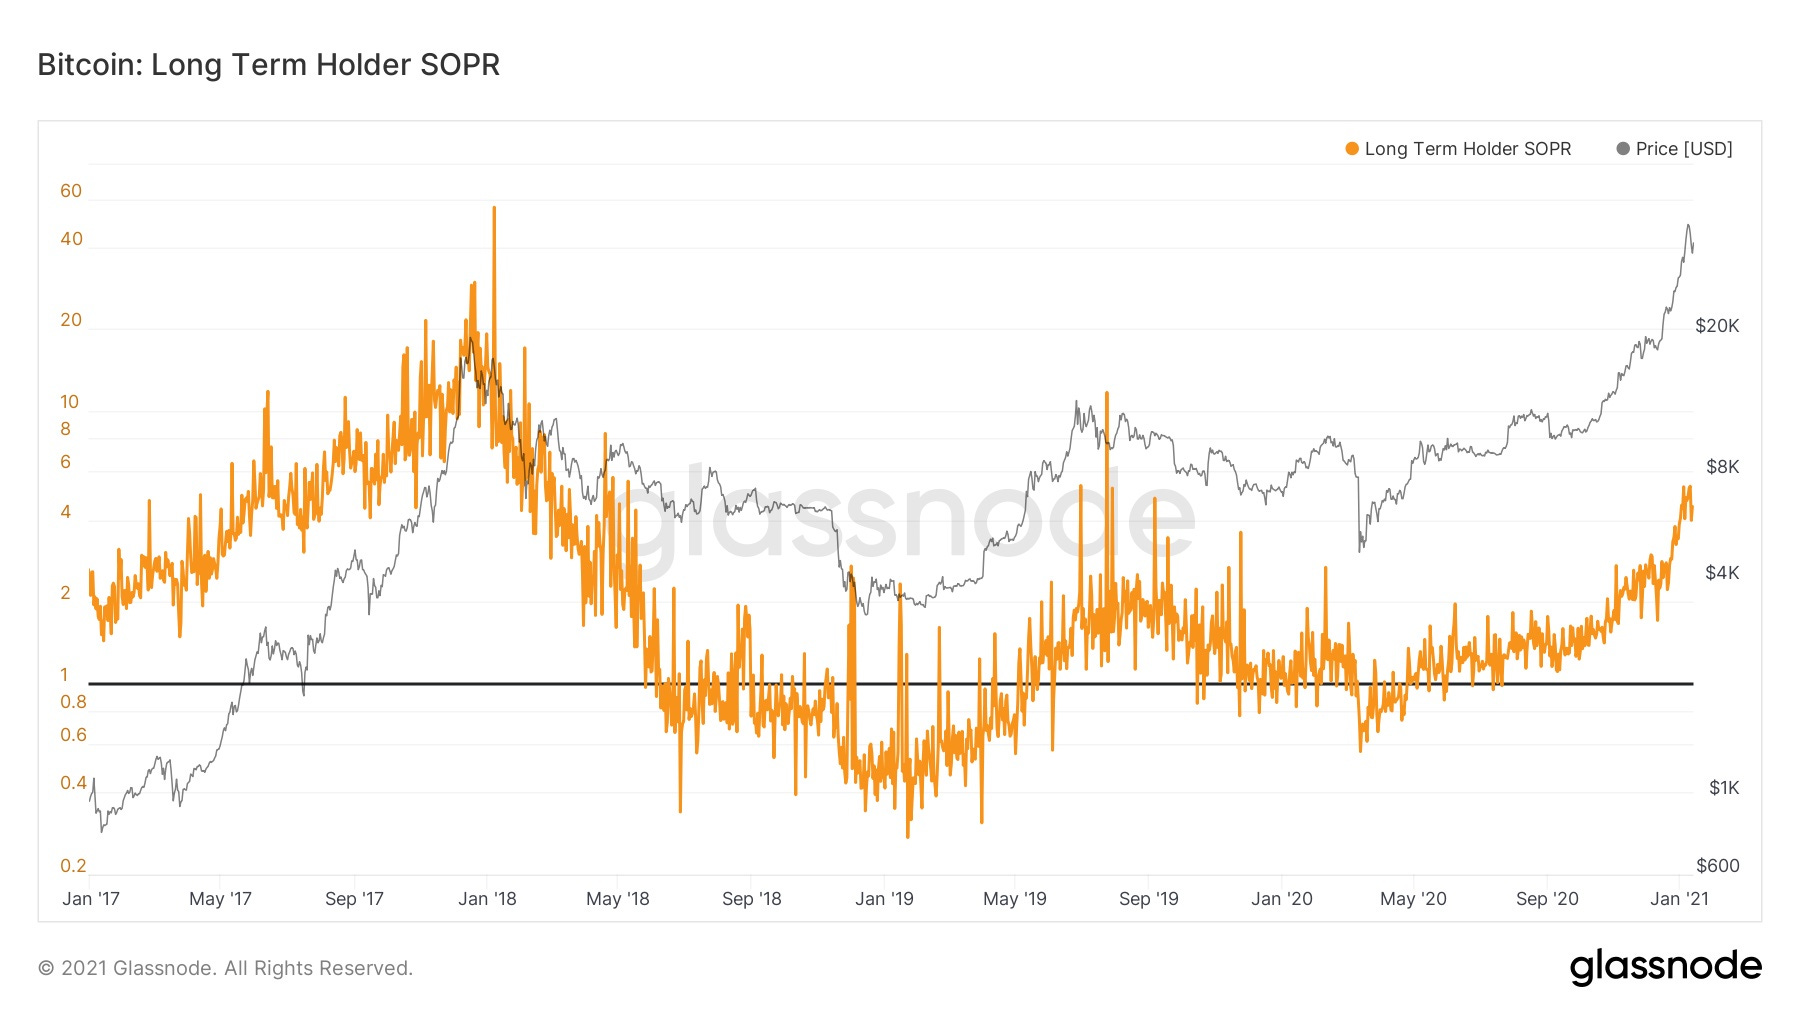
SOPR of Long Term Holders on the other hand, although slightly elevated, is currently moving within a historical healthy range. For reference, after this metric reached the same level in 2017’s bull market, Bitcoin still rallied 20x before reaching the top ($1k to $20k).

Here, the green bars on the right simply indicate the spot volumes, whereas each blue bar on the left shows the amount of existing bitcoins that last moved within that specified price bucket (URDP on studio). Evidently, even though derived from entirely different fundamentals, these two indicators converge on the same support and resistance levels. So despite the thin air up here, we should be relatively safe with major support levels being just above $30k, $27k, and $23k - a sub $20k BTC will be hard to ever see again (excluding the potential of a global black swan event happening).
For the remainder of this year, we are very bullish.
The tide always recedes before the tsunami comes:
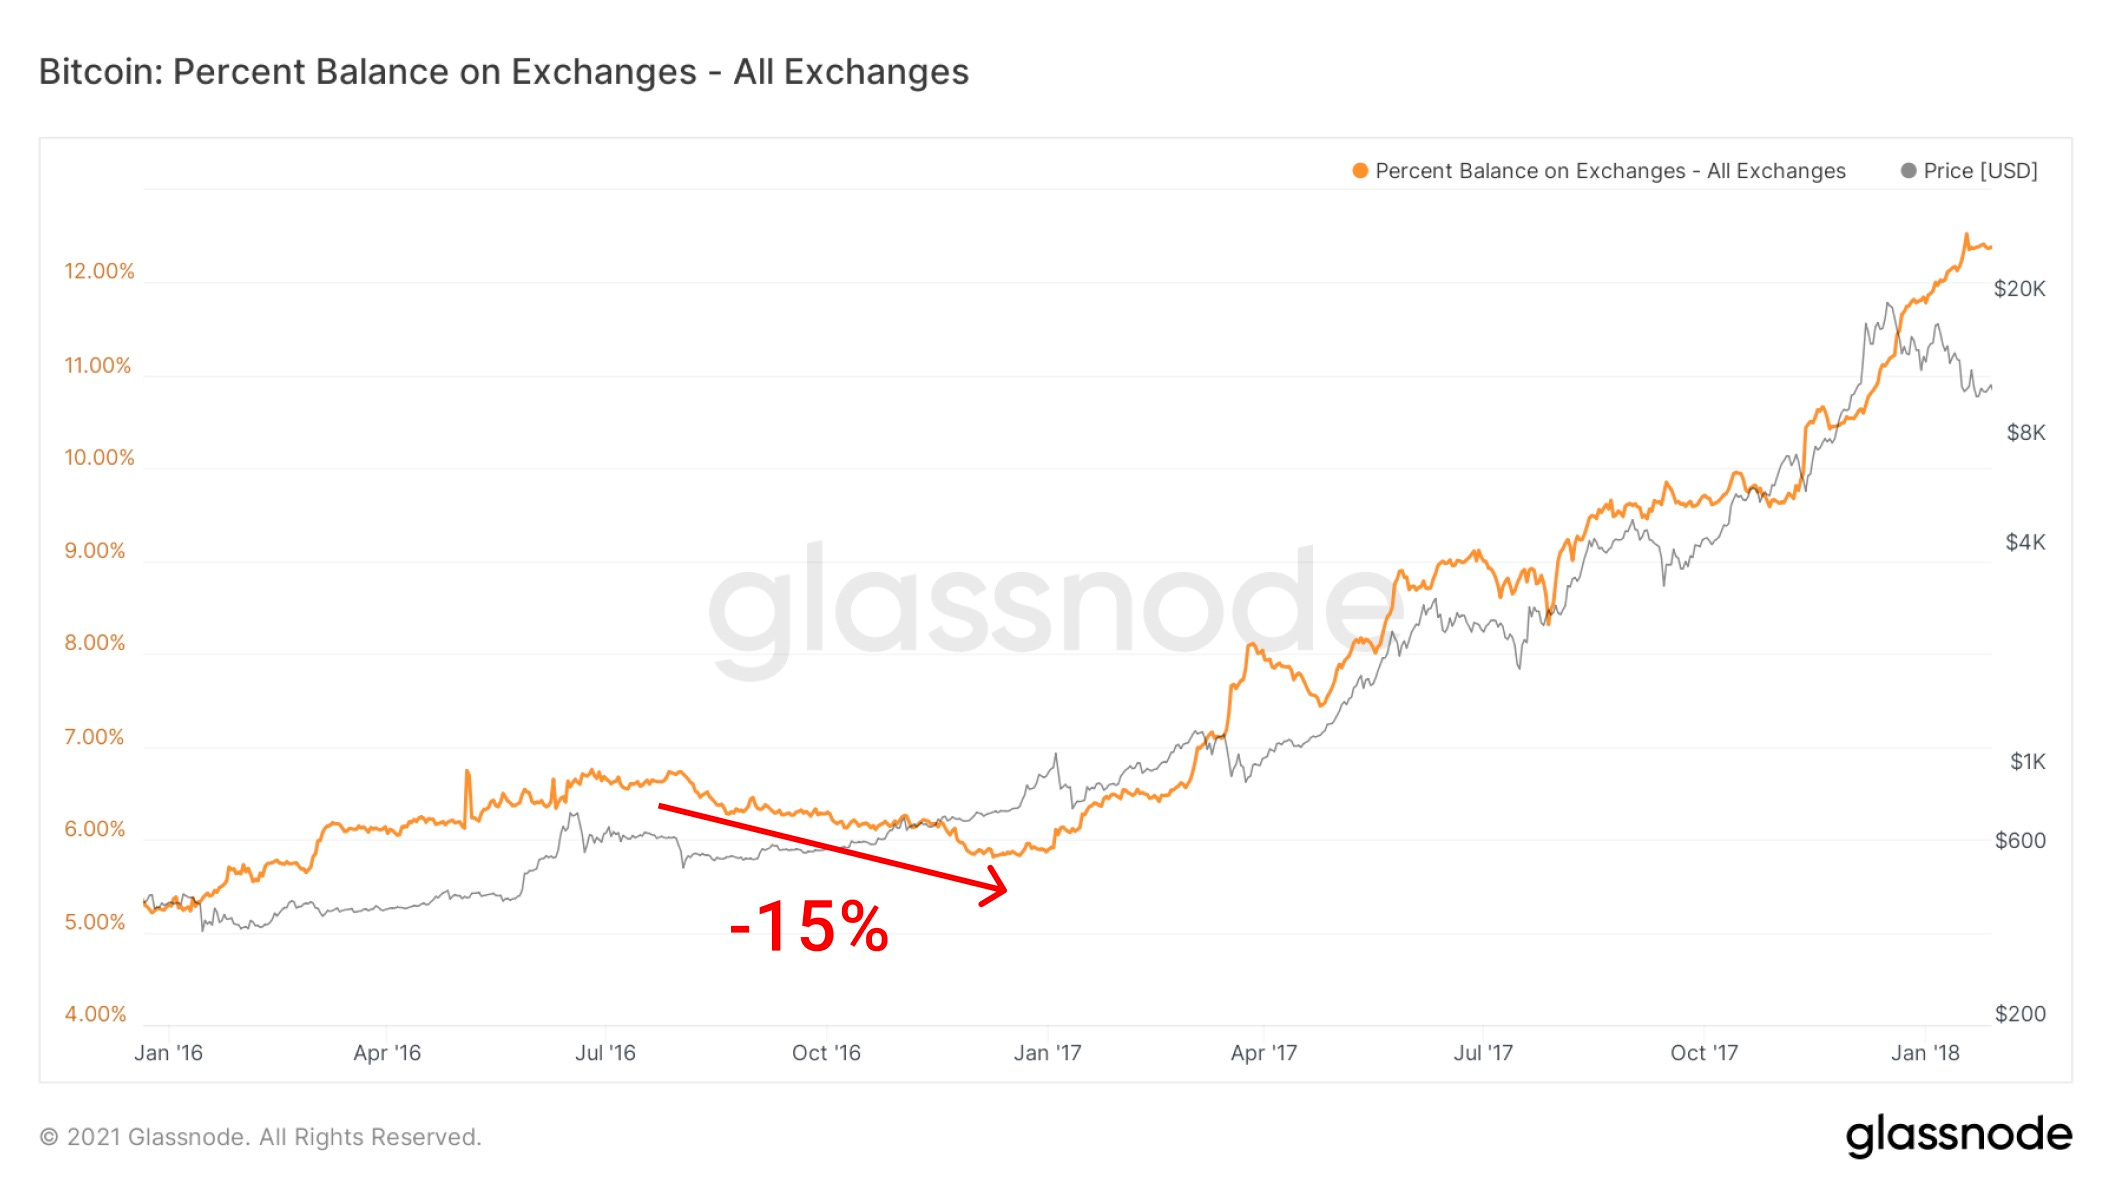
In 2017’s bull market supply on exchanges first contracted, creating a supply shortage that acted like a loaded spring and initiated the subsequent price squeeze to $20k.
Currently we are still in that first phase, but this time will be more intense.

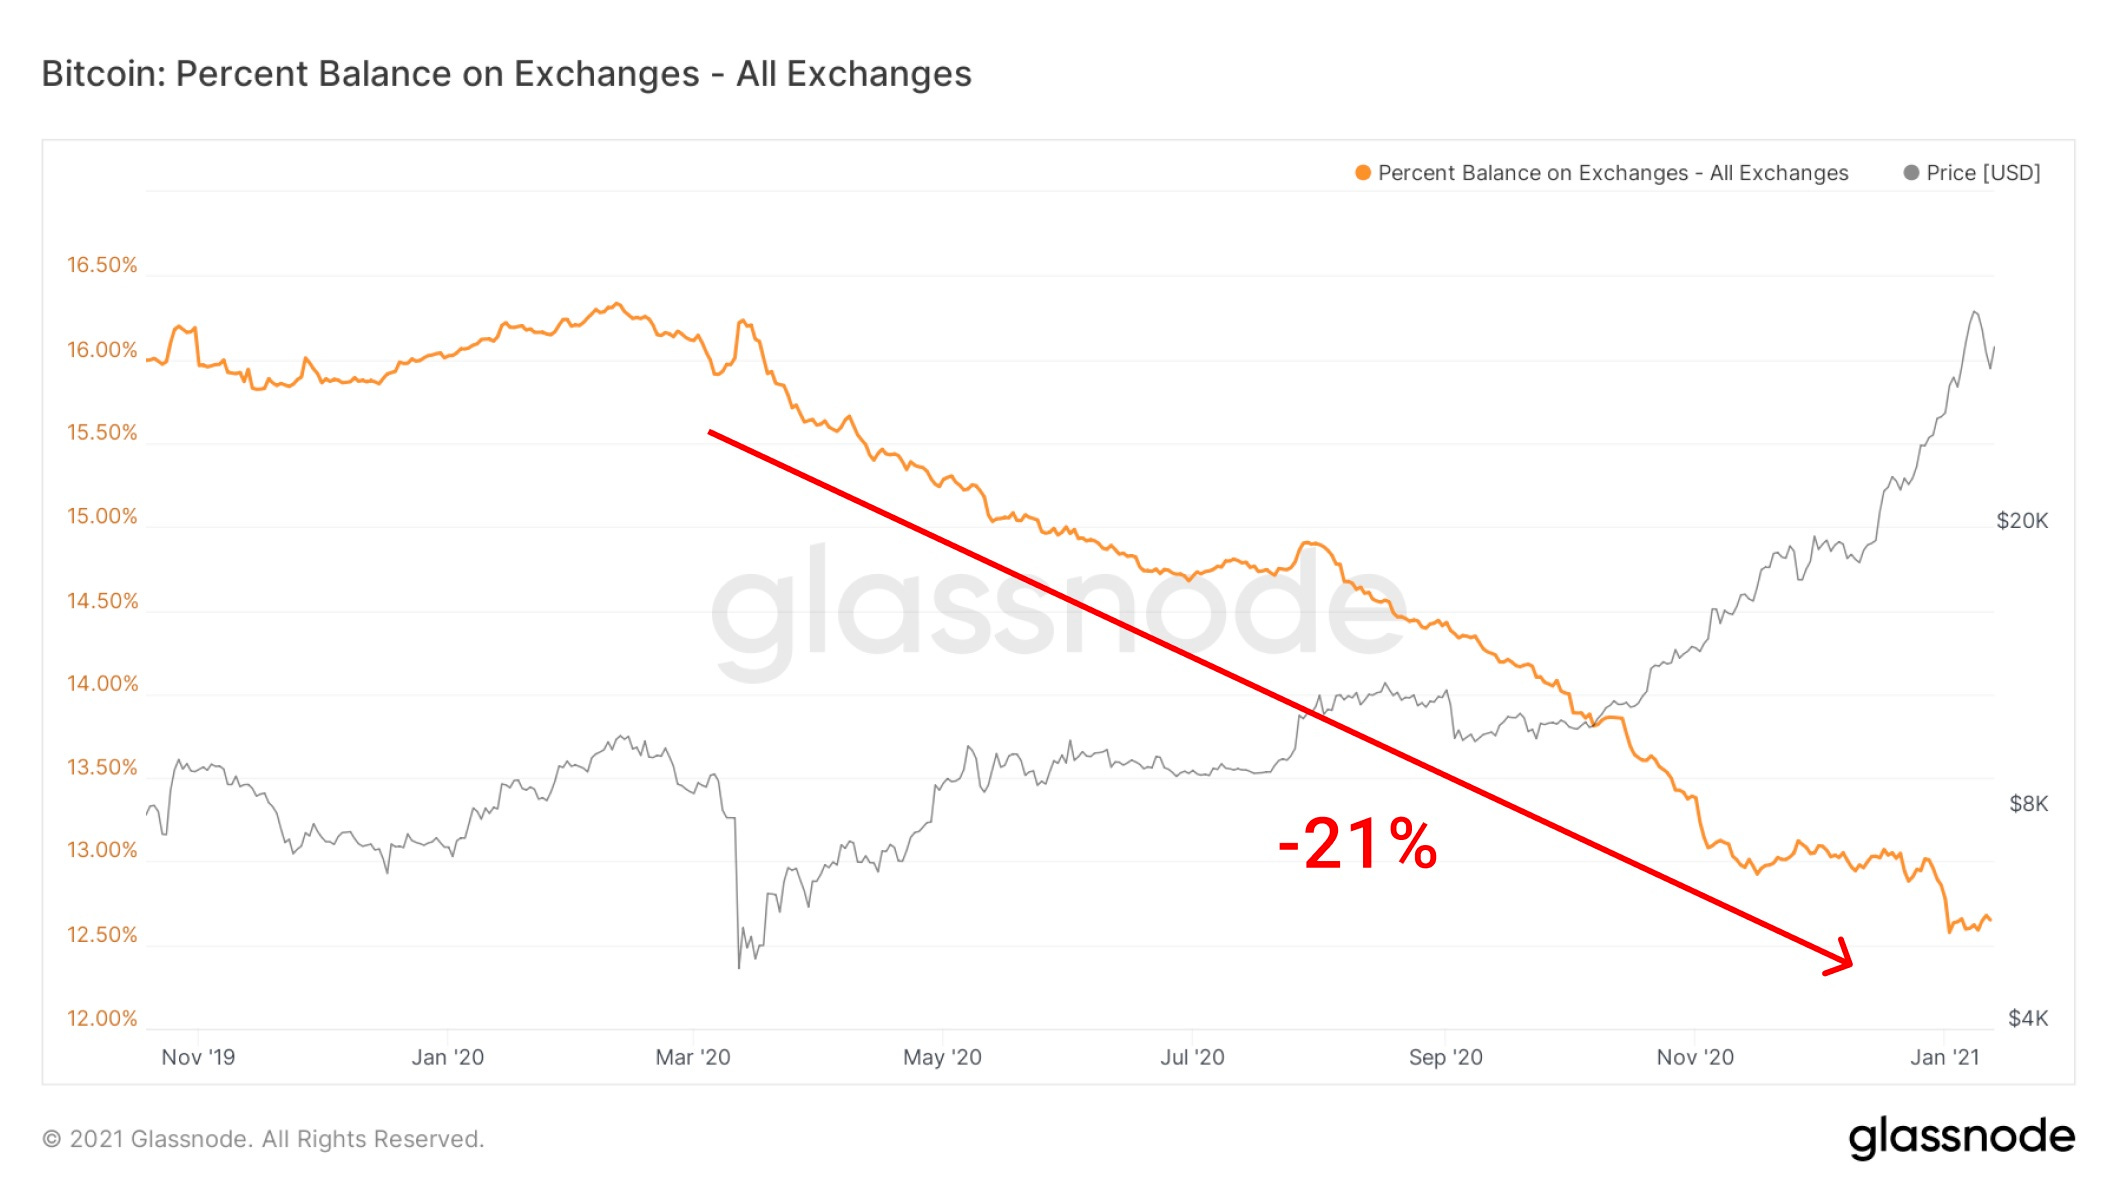
The supply held by liquid entities usually shrinks a little during bull markets as more investors accumulate and store away. However, this time we’re observing an amplified reduction of liquid supply. Currently about 14.6M out of the 18.6M issued bitcoins (78%) are either lost or being hodled long term, leaving less than 4M bitcoins to be shared amongst future market entrants (incl. Paypal, Square, SP500 Companies, ETF’s, etc).

In the above chart we can see that since the march crash of 2020 there was a structural change in the number and the size of the bitcoin exchange withdrawals. Accumulation during 2019 was heavily dominated by withdrawals between 10 -100 bitcoins, while as of march 2020 the ticket sizes were predominantly between 100-1000 bitcoins. This indicates that this time is indeed different as the rally was supported by much larger buyers.
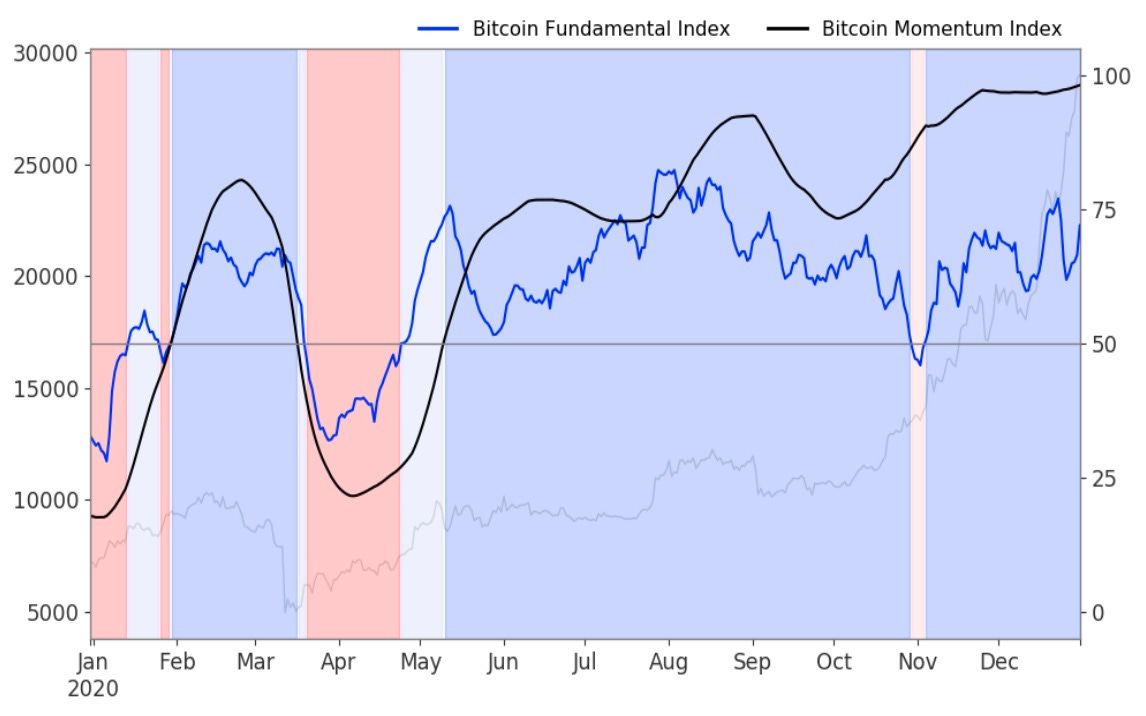
Lastly, our Bitcoin Fundamental Index (BFI), which is an aggregated measurement of various different on-chain metrics paints a healthy and sustainable picture- growth and adoption fundamentals are as strong as ever.
Thats it for now, we’ll keep you updated!
-Jan&Yann
Hey guys, thanks for the great work - keep it up ! Where is it possible to follow the evolution of the BFI (which used to be called GNI right ?) more closely now ? I quite liked how you used to analyze it in your previous insights, maybe there's a way in between ? Cheers
Guys this is an absolutely exception piece of analytics. To the point and concise. Great work. Keep it up!