Dear Glassnode Friends,
We wish you all a fantastic 2022, may it bring you all you deserve and more!
Last May we have mentioned the market to be overheated and that we were expecting a pullback. The subsequent prolonged consolidation period exceeded everyone’s expectation, however, this year might bring us lots of new vibrancy. Thus after many requests, we have decided to continue this newsletter.
Most of the charts are produced in-house, some that are currently not on Glassnode Studio are produced by the R&D division of our quant investment firm Swissblock. We will be introducing some proprietary indices and signals that we believe effectively complement the art of on-chain analysis. Therefore please note that going forward this newsletter will be able to be subscribed to for a monthly fee of $49. Today however we wanted to share this year in review with everyone, so please enjoy.
As usual, clicking on Glassnode charts will take you directly to the interactive live version on studio.
Following a stellar year for the crypto market as a whole, we wanted to take a step back and deep dive into the major drivers that propelled bitcoin’s price action and the evolution of the ecosystem as a whole.
Using our charts, we will analyze the drivers behind each major bullish and bearish event in 2021. We will start by analyzing the continuation of bitcoin’s rise from 2020 into January 2021, the subsequent rotation into altcoins during February, March & April, and the eventual capitulation in mid-May. Towards the end of this Uncharted, we will analyze the second part of 2021, highlight the similarities and differences between Q4 2020 and the first half of 2021, and as a consequence set the stage for what is to come in 2022.
Let's dig in!
The rise, the fall, the consolidation: 2021 a year in review
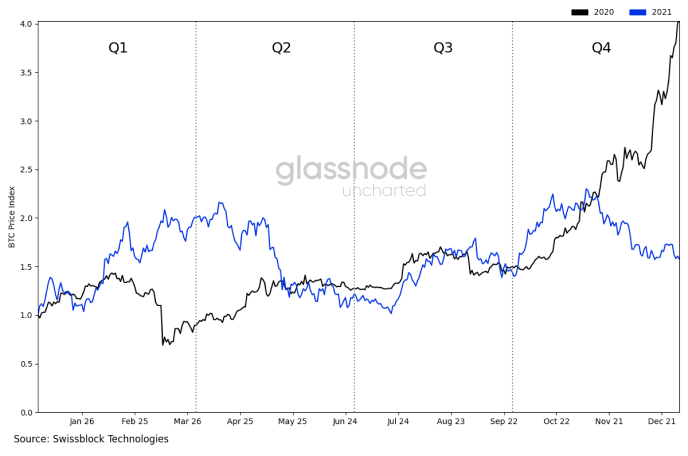
So, let’s start by comparing the last two years of bitcoin’s price action by overlaying them over one another. By doing so, we see that this is a story of two tails. The first is a tail of rapid expansion in 2020, as the world woke up to the potential and validity of the digital asset sector. The second is a tail of consolidation and diversification in 2021, as market participants explored and diversified their knowledge in an ever-expanding universe of protocols and projects.
2020 Performance vs 2021 Performance
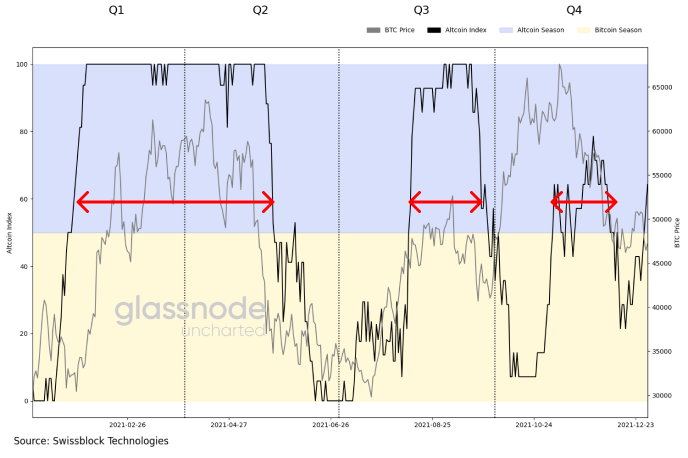
After the explosive rise in bitcoin’s price, towards the end of Q4 2020, many were expecting a repeat for 2021. The price hit a new all-time high around $68k, but it seemed that it was more of a consolidation year for bitcoin, with altcoins outperforming, evidenced by our Altcoin/Bitcoin Cycle signal.
2021: Altcoin Dominated Year
Swissblock Technologies’ Altcoin Cycle signal, a proprietary signal that measures the modality of the market favoring bitcoin vs all altcoins. A reading above 50 indicates a regime with superior altcoin returns, and a value below 50 signals a bitcoin regime.
Throughout 2021 bitcoin’s dominance constantly decreased as more capital flowed to NFTs, DeFi, and bluechip tokens. Notice how the aggregated altcoin’s 24-hour volume spikes (second graph below) in Q4 ‘20 before the Altcoin/Bitcoin Cycle signal shifts regime in Q1 ‘21. But what drove this market shift away from bitcoin?
Altcoin Season Led by Strong Volume
When looking at the systematic increase (red area 1) in logins (users with existing accounts) in Q4, it is clear that the major rise was driven by large whales, institutions, and advanced retail that were already present in the market. The second stage in bitcoin’s price rally and subsequent Cambrian explosion in other assets was, predominantly, driven by new market participants (red area 2), a fact highlighted by the 5x more signups on Binance compared to Coinbase.
Smart Money Drove Bitcoin and Retail Drove Altcoins
During this time, Binance became a dominant hub for new and old retail, as its offerings mushroomed into the one-stop-shop for simple yield services, access to DeFi related products, and combining its trading services with the Binance smart chain provided direct and easy access to thousands of traded pairs across all sectors and protocols. This is evidenced when looking at our Sector Momentum signal, a signal that tracks the exponential trends within each sector in the crypto space (red areas highlight the Binance smart chain ecosystem outperforming).
Binance Gains Momentum as Retail Flocks the Exchange
The Sector Momentum signal is Swissblock Technologies’ proprietary layer 1 momentum signal. The plot shows the 365-day history of the top 5 Ecosystems over the last 14 days. A high reading on the momentum signal means an increased likelihood of an exponential sector-wide price move.
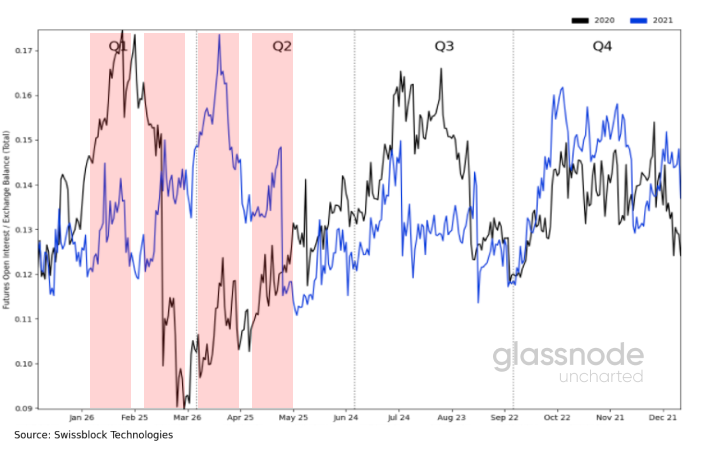
One interesting thing to note is that the open interest as a ratio of total bitcoin on exchanges peaks with the Binance Ecosystem activity before the mass selloff on May 11th, 2021, indicating a general increase in speculation and leverage across the board.
Speculation and Leverage Leading to Massive Sell-off
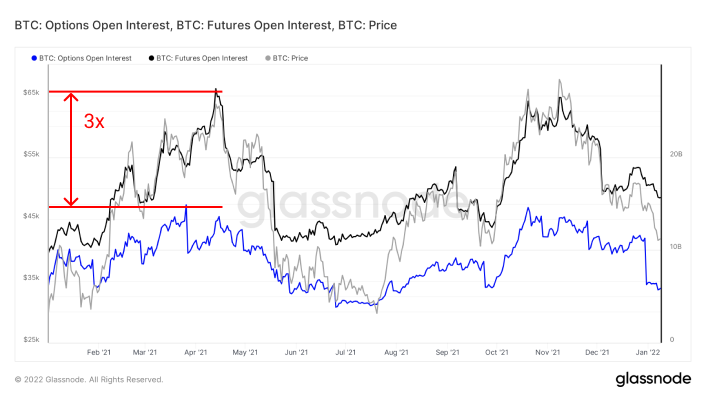
More specifically, we see the evidence of this drastic rise in speculation when we look at the explosion of open interest for calendar futures and options, along with the elevated funding rates for perpetual futures contracts, signaling an overcrowded long trade (large funding rates are only unsustainable when the demand for the underlying lags behind significantly).
Overcrowded Bullish Speculation
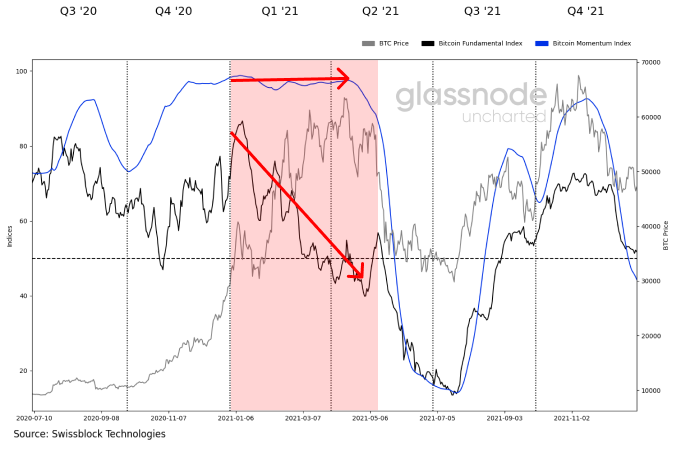
The increase in speculation is also apparent when we look at the decoupling between bitcoin’s on-chain fundamental activity and the price, as more users started to look for alternative protocols to invest in, and speculation concentrated on these centralized exchange platforms.
Fundamentals and Price Action Diverge
The Bitcoin Fundamental signal and Bitcoin Momentum signal form part of Swissblock Technologies’ proprietary indices, that represent bitcoin’s fundamentals and bitcoin’s future returns expectations. A reading below 50 is considered bearish and a reading above 50 is bullish.
The Bitcoin Tail Risk signal further underpinned the dislocation between price momentum and fundamentals. The signal started to indicate an elevated risk of price retracement once the gap between fundamentals and price became unstable in mid-April.
Emerging Elevated Risk
Swissblock Technologies’ proprietary Bitcoin Tail Risk signal shows a measure of the market risk bitcoin is exposed to by modeling the amount of tail risk present in the system. A high reading means Risk ON, i.e. higher risk of a major drawdown.
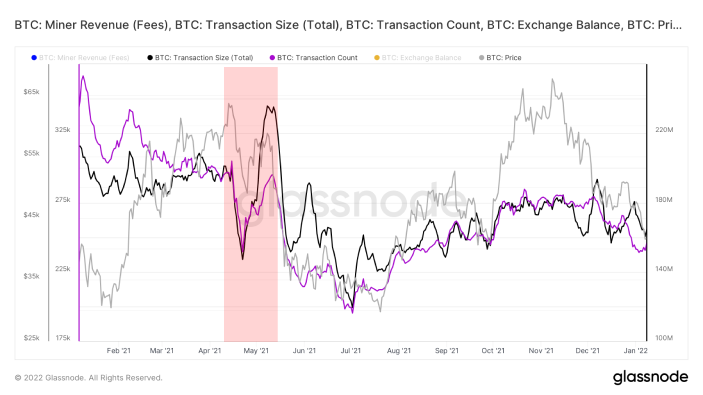
During this same period, fees paid to miners decreased nearly 83%, as bitcoin's on-chain activity started to fall drastically. Yet within this slowing down of on-chain activity, there was a substantial spike in bitcoin being sent towards exchanges.
Bitcoin Selling Pressure due to Inactivity
This drastic change of flows towards exchanges is more evident when looking at the delta net position change of exchange balances and changes in the global liquid supply.
Abundant Liquidity in the Market
What is interesting to note is that this large fee spike aligned with the voluminous inflow of bitcoin towards exchanges. During the same period, the size of transactions increased drastically, and the number of transactions fell. These four elements imply that some market participants were anxious to sell as fast as possible.
Anxiety Shakes Investors
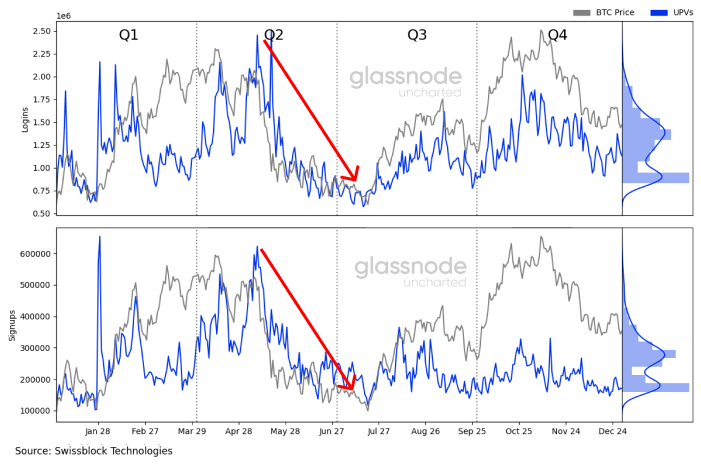
After the market price collapsed, logins and signups also decreased, a clear indication that we had a subsequent shift in the type of actor in the space that was driving demand, the mass retail wave of buying pressure subsided quickly.
Retail Shakeout
As exchange inflows started to accelerate, we simultaneously saw an increase in aggregate daily volume traded in altcoins, implying an ever-increasing willingness to take profit across the board.
Altcoin Volume Spikes as Investors Take Profits
The beginning of this drastic rise in aggregated altcoin volume corresponds with the outperformance of ethereum versus bitcoin (red area) and ends with the strong sell-off in both assets on May 11th.
Ethereum Outperforms Bitcoin Before the May Crash
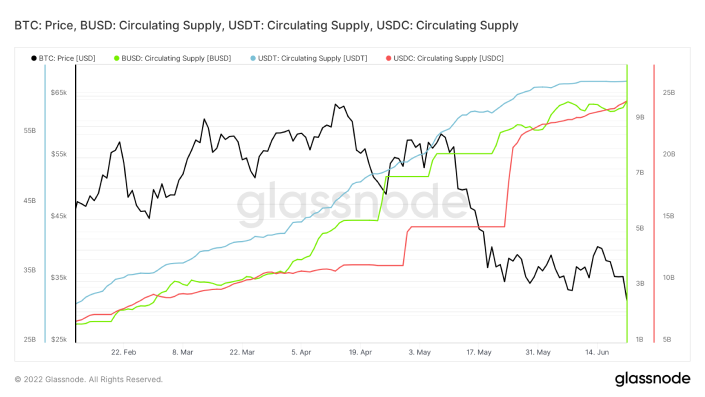
A rapid rise in stablecoins' circulating supply and demand to preserve wealth - increasing to over more than $25 billion between April 15th and May 30th - further reflects the sell-off in all major assets, as market participants fled to safety.
Investors Flee to Safety
How did the second half of 2021 look? Was it a repeat of January to April after the consolidation seen in June and July? We need to go back and look at the market composition to understand the similarities and differences. From a login/signup perspective, we never recovered the yearly high seen in Q1 2021, indicating that the existing market participants decreased along with a lower rate of new actors entering the space.
Less Active Exchanges on Second Half of 2021
Bitcoin's spot volume never recovered to the previous yearly high, as the composition of market participants, which were dominant in the second half, was different. The second half of 2021, as defined by the entrance of more sophisticated traders and investors, included bitcoin in a broader portfolio of assets. This can be seen in multiple different ways, starting with the increase in volume traded of the largest Mining stocks that are listed on the US stock exchanges.
Sophisticated Traders Get Bitcoin Exposure in Traditional Markets
Another area that has seen steady and accelerating flows has been the ETF sector. One example of this is the Purpose ETF that has seen a steady inflow since mid-year.
Purpose ETF Sees Accelerating Flows
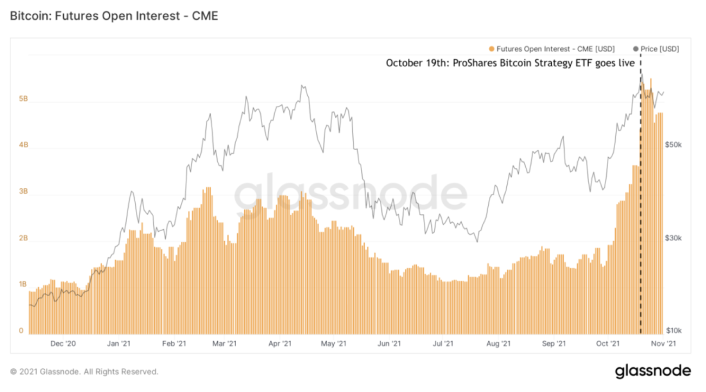
While the SEC allowed for the first US-based futures ETF, we have seen a drastic increase in CME open interest, indicating the entering of larger, more, sophisticated mainstream players in the system. These players make much greater use of bitcoin futures to get directional exposure and hedge other aspects of their mainstream financial portfolios.
Sophisticated Mainstream Players Enter the Market
Due to this growing dominance of traditional mutual funds, hedge funds, and family offices, we can see a very high correlation between the S&P 500 and Nasdaq. Since the end of bitcoin's price correction in mid-2021, we have been in a regime with an ever higher correlation to US equity markets.
Strong Ties to US Equities as Well Established Players Get Bitcoin Exposure
A view forward into 2022
So, where do we stand for the new year? Will we see a lagged repeat of Q4 2020, or can we expect another consolidation year? Like we saw in 2020, it will be paramount to keep a closer eye on traditional equity markets, the strength of the dollar, and the yield curve. We can expect choppier and correlated markets with higher rates potentially on the horizon.
In terms of traded volume and on-chain volume, it is clear that we have started to build a foundation between $40k-$42k for bitcoin’s price. Meanwhile, most market participants, with large multiples of profit, have been reset, and we have seen an increase in demand for spot at these current levels. But to understand the sell-side dynamics, we need to take a look at Short and Long-Term Holder dynamics.
Liquidity and Activity Building Up Between $40k-$42k
Short-Term and Long-Term Holder profit and loss dynamics give us a good understanding of the propensity for each group to keep selling or buying. What we observe in the current market regime is that Short-Term Holders are nearly 99% out of profit from where they bought, meaning that if Short-Term Holders continue to sell their positions, they will be doing so at a significant loss. From a market psychology perspective, this is very important, as selling in profit is fundamentally different than selling at a loss. When looking back to the beginning of 2020, we see that a reset of Short-Term Holder profit has been the signal that we are close to a bottom.
Short-Term Holder Market Psychology
When looking at SOPR for Long-Term and Short-Term Holders, we see that Long-Term holders are still within the profit area, meaning that they are transacting at a price higher than the one they bought at. Short-Term Holder SOPR, on the other hand, clearly shows the reset that we have experienced with the price drop. As long as market psychology doesn't turn to capitulation, we should see subsidence of selling pressure in the medium term.
Long-Term Holders Selling at a Profit, Short-Term Holders Selling at a Loss
To reinforce the notion of profit-taking, we can take a look at the Stablecoin Supply Ratio Oscillator (SSRO). SSRO is the ratio of the bitcoin supply and the stablecoin supply, denoted in BTC. When the Oscillator is high, it signifies that stablecoins have a weaker buying power, as bitcoin increases in value, while a low SSRO implies that stablecoins have an increased purchasing power. What we see below are areas where the SSRO bottomed due to increased demand for stablecoins as everyone flees into safety, along with a decrease in bitcoin's price. This has been a good indicator of pent-up potential energy that could at any time renter the market as buyer demand increases.
Stablecoin Buying Power
In terms of our on-chain fundamentals, we have seen a strong rebound for the first week of 2022 compared to the last two weeks of December. Currently, we are seeing a 20% increase in new addresses being created, with transaction count and volume also rebounding. We can also see a solid increase in spot and derivatives trading volume.
2022 Kicks Off With Strengthening Fundamentals
Open interest on options is also showing a large increase in January 28th and Mach 25 contracts (left spider graph). When we look at the open interest in terms of their strike price, it is evident that there is a skew towards the upside, with the bulk being placed between $50k-$70k.
Increasing Bullish Interest in the Short Run
The increase in open interest towards March 2022 around $50k-$70k strike price levels reflects a shift in investors’ behavior since the phenomenon coincides with decreasing put prices. Put prices tend to increase when bitcoin drops as investors use options to hedge their spot positions. However, put premiums become less expensive relative to calls, once the price settles down. Bitcoin’s 3-month 25D Skew shows that puts are less expensive as the metric trends downward while bitcoin holds the $42k support level. The shift in the trend coupled with the higher open interest redirected towards higher strike prices reflects less hedging behavior as investors begin to speculate over higher prices.
Shift in Investor Behavior
The Bitcoin Tail Risk signal, also indicates that we are approaching an overextension on the sell side, meaning that we are closing in on a bottom for the current sell-off period that has lasted since the end of November.
The Beginning of the End
So, bitcoin’s Q4 2021 setup for 2022 may seem shaky compared to the environment in Q4 2020 and Q1 2021. Fundamentals and momentum are relatively low, and there is a high risk in the system compared to the start of 2021. That is not to say that bitcoin cannot break a new all-time high this year. The price is holding the $40k-$42k support level as volume is picking up across all markets, well-established players have increasing access to bitcoin through traditional financial instruments, and there is a lot of buying power sitting on the sidelines, ready to be deployed at short notice. Hedging behavior is subsiding as the November sell-off is coming to an end, setting the stage for a move up to higher grounds.
That would be all for today, thanks for all your support and may the trend be your friend!
- Yann&Jan (@Negentropic_)














let's keep going. there's still more top than bottom. no sweat!
I read it in 30 min ! and learned equal to hours of self-research ... astonishing !