


Dear subscribers, today we would like to deep dive into some dynamics of the different market participants, as we believe that they are a key component to keep an eye on during this bull cycle.
We will first highlight the type of players currently entering the space and then towards the end of the piece how their current behavior compares to that of the last bull run in 2017.
We will make sure to post any updates in-between our uncharted publications through our twitter account (@Negentropic_).
As always, please note that this is not intended as financial advice (yes, unfortunately we really do have to state this).
One last thing.. unfortunately substack keeps warning us about the size of these issues being too large, which would have the consequence that it might cut off the end for those of you that read it in your inbox. In that case, we would kindly ask you to just read it on substack.
We hope you enjoy this update, let’s dive in!
Let’s start with Elon! He has indeed sent massive shock waves into the cryptosphere, and as a consequence we have seen a strong resurgence of retail interest in the space, increasing from an average of 2-3M of daily active users to 4-5M beginning of February.

The incredible rise in twitter followers of figure heads such as Pomp or our fellow glassnoder Willy Woo further shows the accelerated inflow of retail throughout the last weeks.

Another way to observe recently heightened retail interest is through the rapid increase in our altcoin indices that track the top 250 tokens in the space.

Capital rotation into altcoins is further confirmed by our Altcoin/Bitcoin Cycle Index, which is a measurement of the relative performance of bitcoin compared to a large selection of digital assets.

So to recap, bitcoin started the year consolidating between 30-35k, allowing many alts to rally. This changed overnight with the heightened attention Musk brought to bitcoin, pushing it above 40k within hours of Teslas bullish announcement. Since then both bitcoin and alts have been rallying, an indication of both new institutional and retail money flowing into the space.
The accumulation of bitcoin since the beginning of last year has been occurring in stages. From March to beginning of December we saw heightened outflows from Fiat-On-Ramp exchanges towards institutional holders, indicating strong spot demand. In 2021 these outflows have started to lessen.

The spot demand of institutions seems to have flattened in January, however the total number of withdrawals from exchanges was still accelerating, seeing the highest single day withdrawal since the later stages of the 2017 bull market last week. This shows that other market participants are accumulating.

...and is further supported by a continuous increase in the total number of new market participants in the last couple of weeks.

As institutions reduced their spot purchases throughout December, their demand for levered exposure through futures increased into January, a sign of increasing risk appetite.

This increase in demand for futures becomes more apparent when looking at the sharp increase in traded volume of these derivative products, especially comparing December 2020 and January 2021. Our Futures index measures the magnitude of the volume increase since the beginning of last year.

This phenomenon seems to be present in the space as a whole.
We can see that throughout this bull market so far (October 2020 onwards), the Futures to Spot volume ratio is trending upwards, indicating that investors are risking more leverage and speculation is increasing.

Currently, Open Interest is at a historical all time high, just over 16 billion total In value. An increase of 60% since January 1st.

With a short term fall in perpetual swaps volumes to 60 billion, traders are waiting for a response in the market before deciding to either increase or reduce their risk profile.

This decrease in traded volume is also evident when looking at the Year to Date volatility profile for bitcoin, indicating a low volatility environment. It seems like the market is waiting for further confirmation of a retest of that 50k resistance or a break lower towards 40k support level.

Funding rates seem to get more overheated with every new ATH, but as long as spot demand remains strong this shouldn't be a game changer. A major concern would be a combination of high funding rates with high futures to spot volume ratio, as that would scream for a larger price correction.

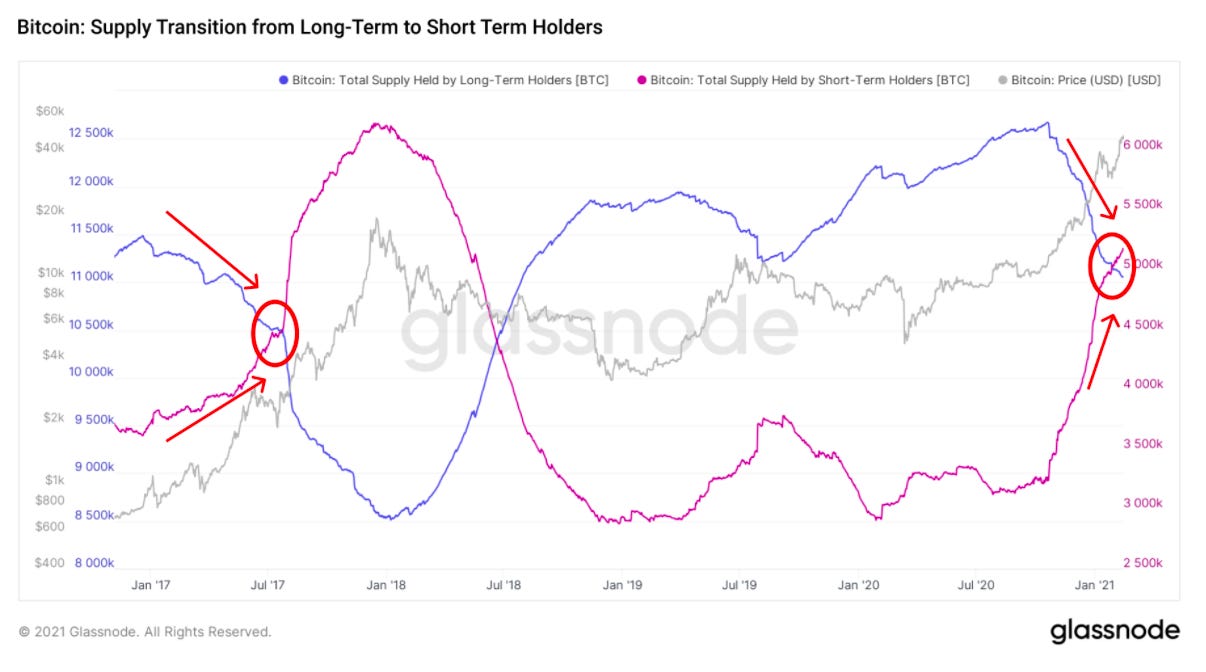
Alright, so is this the top for bitcoin or just the beginning? To understand that lets take a step back and analyze the bitcoin bull cycle as a whole. As mentioned in previous uncharted updates, the macro bull cycle starts with a reduction in on-exchange supply, which leads to a supply squeeze.

This supply squeeze, created by long term holders accumulating, results in an increase in price. This in turn attracts retail and other types of short term holders that also start to buy in.

Once short term holders have accumulated a certain amount of the available float, they start to become an important market driver, affecting short term cycles in price. Unlike long term holders that are very inelastic towards changes in price (since they accumulated much lower than the current price), short term holders are much more elastic to price, and therefore respond faster to changes in bitcoin’s price.

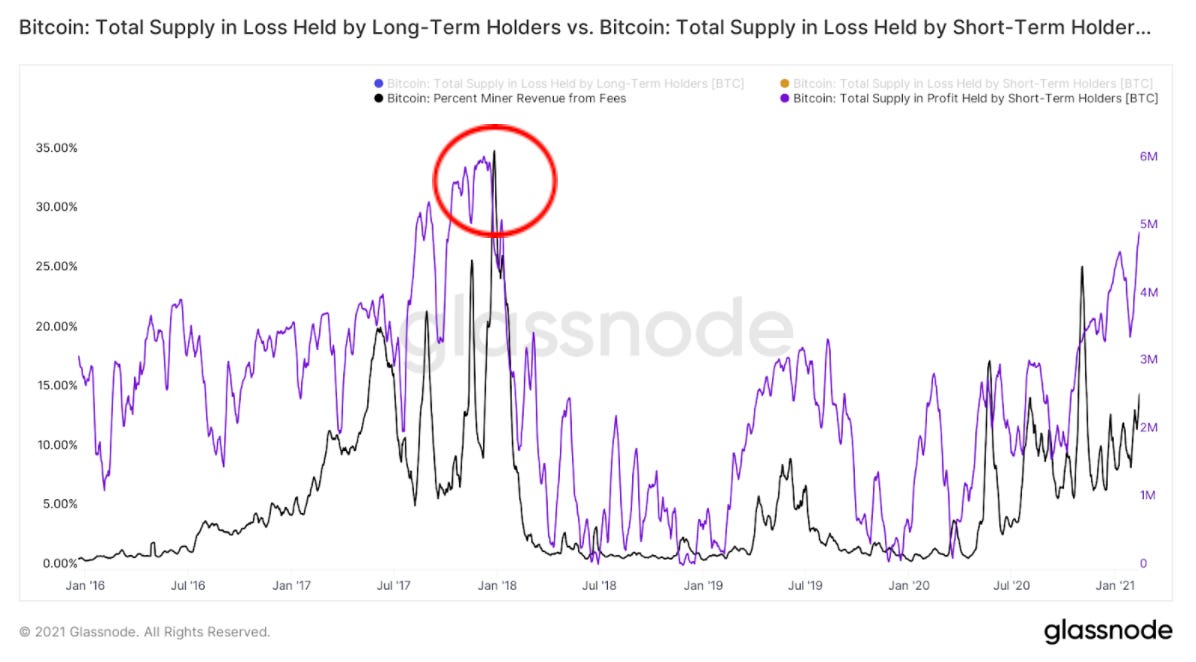
Therefore it is important to keep track of the short term supply that is in profit, as any change in price over a certain magnitude can cause a mass short term selloff. This effect becomes extreme at the later stages of the bull market, as short term holders become more and more sensitive to price movements.

Once the price increases to a certain level, old and new players start to increase the number of deposits towards exchanges, in order to capture profits or speculate on price discovery. Comparing our current cycle to the last bull run in 2017, it becomes clear that we are still in that early acceleration phase of the curve. Note that it is important to normalize the number of depositing addresses to the number of total addresses in the network, which increased about 3 fold since 2017. Thus one should divide the current number of addresses on the chart below by 3 to make any valid comparison with the previous bull run.
We are not at the end until the number of addresses depositing to exchanges goes exponential.

This acceleration of deposits coincides with many of the short term holders being in profit, as their increased urgency to send coins to exchanges starts to bid up transfer fees.
As things stand in historical terms we are in the middle of this supply transition from long term holders to short term holders. This transition, although faster than in 2017, is a strong sign that we have moved out of the initial accumulation phase.
That’s it for today. Thank you all, till next time!
-Yann&Jan
Uniquely good read in the crypto space. The only post I know with more data than speculation. Keep it up!
Great analysis and write up! Thanks so much for putting this out - highly appreciate it! You were mentioning in a previous post that you were debating the idea of a Telegram channel for more frequent update. If you have anything in the pipe for that, please let us know