Dear subscribers,
Bitcoin's $17-$18k support level held the ongoing pressures from traditional markets. The short-term downward trend slowed, and the Altcoin Cycle Signal pivoted to a bitcoin season. However, the risk remained high, and there is no confirmation of a bullish trend reversal.
Let’s dig in!
TL;DR
Bitcoin remained within the bearish zone according to Swissblock's State of the System.
A strengthening DXY pressured bitcoin and US equities in a highly correlated environment.
Selling pressure subsided for bitcoin, but demand remained low.
Bitcoin drives the market once again as altcoins lost steam.
Risk in the system
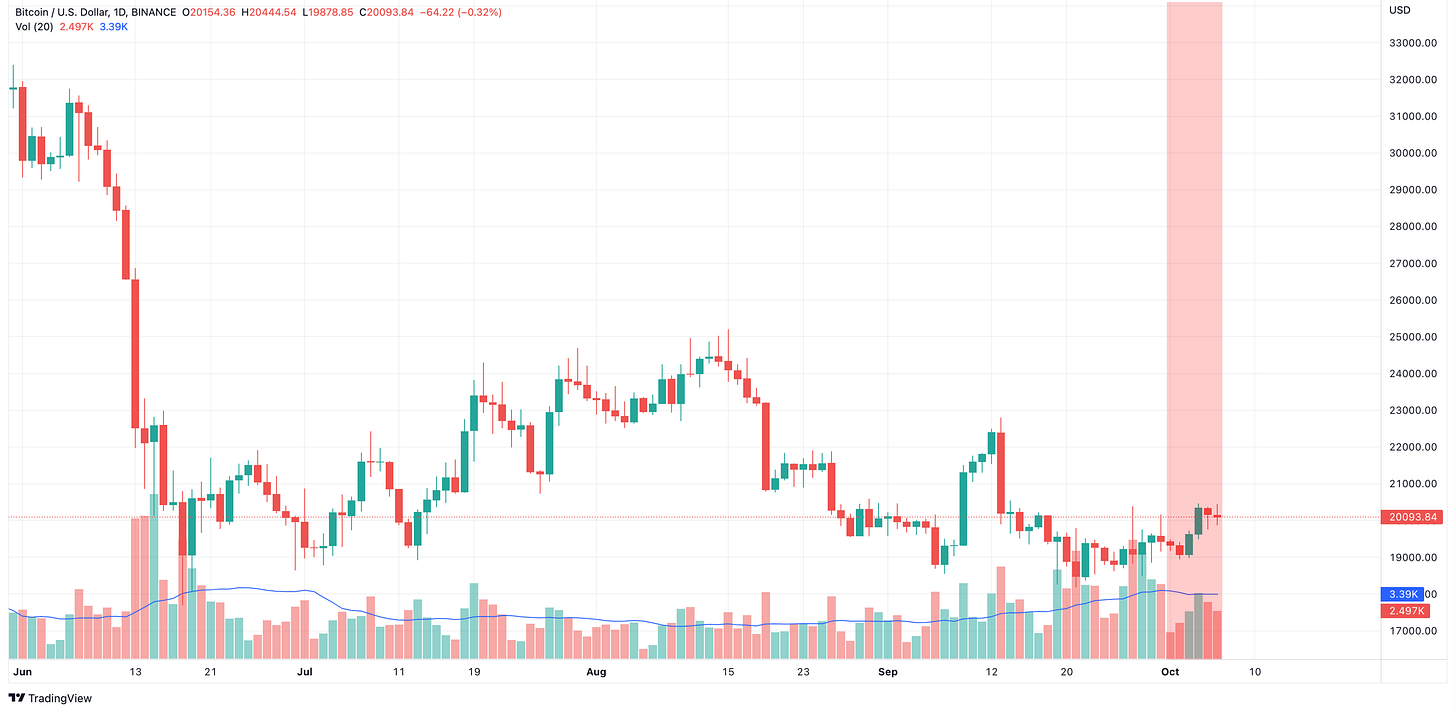
Since Uncharted #24, bitcoin gained nearly 4%, struggling to break above $20.4k (Figure 1). The hefty liquidity at $17-$18k withheld the price action from going lower and served as a catapult for $20k, as we stated in, Figure 20 of the previously said Uncharted.
Figure 1: Bitcoin up 4% since Uncharted #24
According to Swissblock’s State of the System framework, bitcoin’s risk of a pronounced drop - potentially below $17k - slightly decreased as the bearish trend slowed since Uncharted #24 (Figure 2). Let’s break it down.
Figure 2: The State of the System
Risk in the system → easing yet high risk
Market force → altcoins lost steam due to renewed bitcoin dominance
Beginning by analyzing the risk in the system, we note that Swissblock’s Bitcoin Risk Signal remained within the high-risk zone, but decelerated as bitcoin gained traction early this week (Figure 3).
Figure 3: Subsiding yet high risk
From a macroeconomic perspective, the pressure on bitcoin is still on. Like the SP 500, the long and short-term trend remained in the bearish zone, while a robust DXY bullish trend extended. If the DXY continues to rise, bitcoin will likely see weaker price action (Figure 4), considering the continued close ties to traditional assets.
Figure 4: Bearish long and short-term trends
It is noteworthy that bitcoin’s 28-day rolling volatility remained below 80% even as US bonds and the SP500 swung aggressively. The volatility structures continued to show greater parity as the relative volatilities decreased, indicating a systematic risk rather than a crypto-idiosyncratic risk (Figure 5).
Figure 5: External pressures driving bitcoin's price action
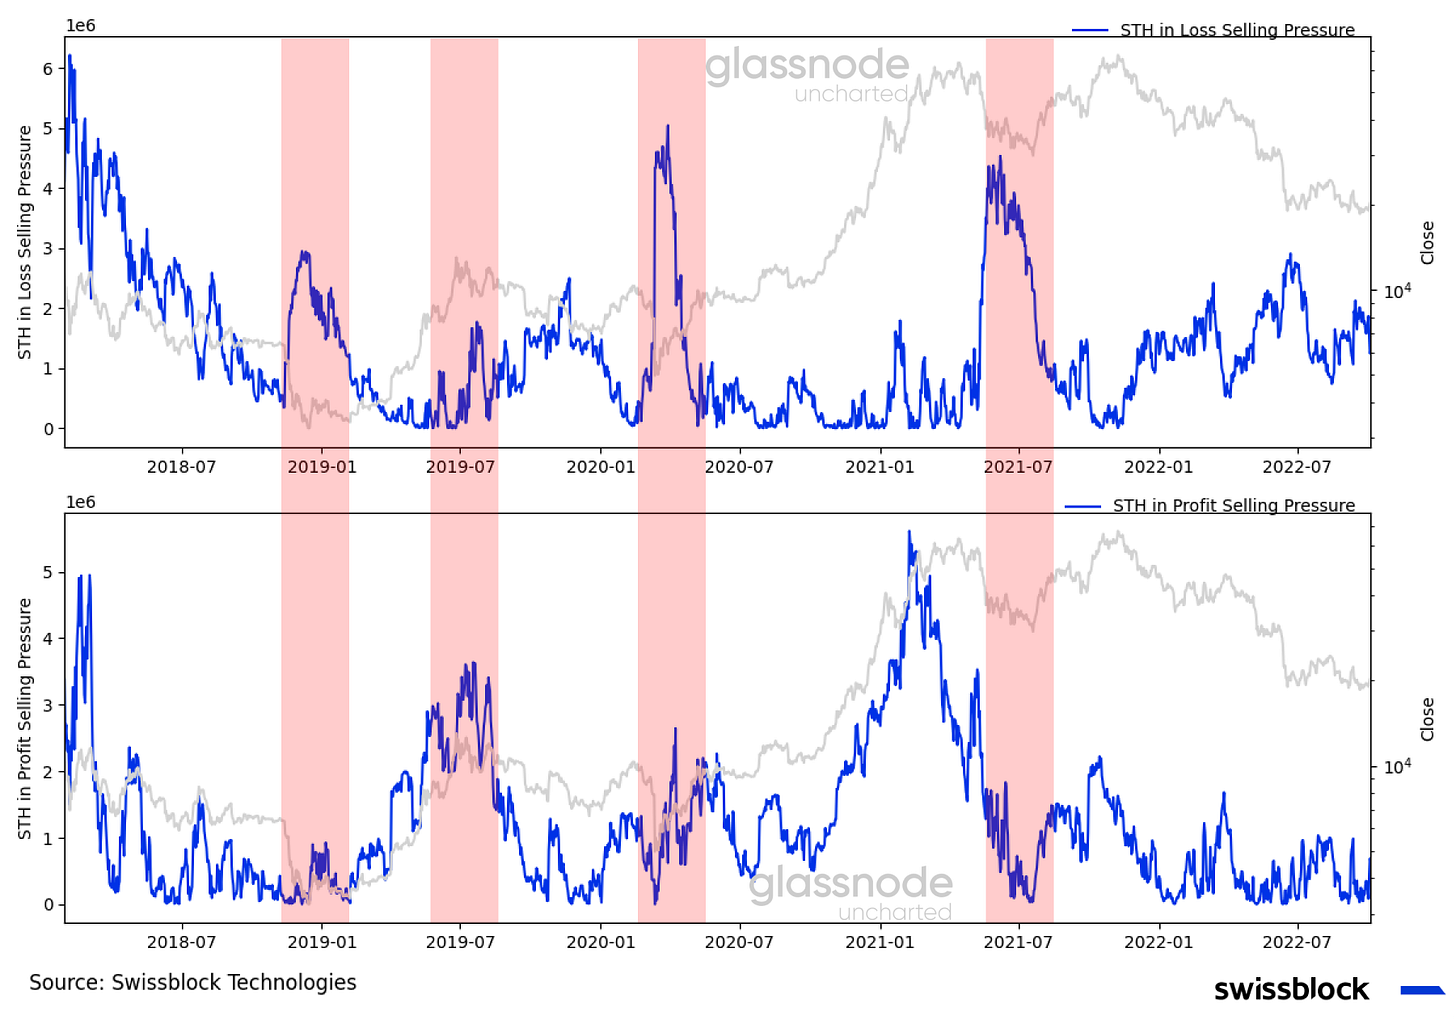
With “safer” alternatives swinging aggressively and relatively low volatility, there is no significant incentive for short-term holders in loss to capitulate or short-term holders in profit to take profits (Figure 6). The said metrics have been indicative of historical tops and bottoms, respectively.
Figure 6: Subsiding short-term holder seller selling pressure
On the other hand, there is no indication of increasing demand either to drive the price over the $25k mark. Notice how the short to long-term realized value decreased and prevailed in the “red” zone, as low short-term velocity (low demand) stubbornly remained. This has been a characteristic of a bear market (Figure 7).
Figure 7: Low short-term velocity reflected a lack of interest
Zooming into the past week, we can observe the lack of demand behind the recent rise to $20k (Figure 8). Even though the buy volume has exceeded the sell volume in size - spot market -, the overall daily traded volume logged was below the 20-day moving average.
Figure 8: Dead cat bounce?
As the traded volume slowed, we noticed a change in the dynamics of the futures-to-spot volume ratio since Uncharted #24. The futures volume picked up, and the delta accelerated to the positive zone (Figure 9), suggesting more speculation in the market as the risk of abrupt price swings eased.
Figure 9: Relatively low volatility driving speculative behavior
Beyond speculation, an increasing futures-to-spot volume ratio can also suggest leverage in the system, which translates into risk in the current environment. However, it appears that it is not the case. A decreasing low futures volume/open interest ratio coupled with an increase in open interest reflected greater confidence in the system and reduced leverage compared to January and May 2021 (Figure 10).
Keep reading with a 7-day free trial
Subscribe to Swissblock Insights to keep reading this post and get 7 days of free access to the full post archives.


