Dear subscribers,
Before diving into the macro picture, we want to acknowledge a milestone for crypto as a whole: Ethereum’s Merge was completed successfully on September 15th. In Vitalik Buterin’s words, The Merge will reduce worldwide electricity consumption by 0.2%. The energy savings exceeding 99% continue to be the key benefit of Ethereum’s move to proof of stake.
Furthermore, the Merge has made ETH deflationary, as the supply is shrinking. While these are good news fundamentally, the market has yet to show enthusiasm for this success: Ethereum has continued a near 10-day streak of days with negative returns, even breaking below $1.3k, dragged down by increasing systematic risk and slowing altcoin season as bitcoin takes the spotlight.
Let's dig in!
TL;DR
Bitcoin dropped below $20k again due to intense pressure due to the FOMC meeting and J Powell’s remarks about the economy.
The state of the system suggests a high-risk environment and a pronounced bearish trend.
Substantial traded volume in the spot market dominated a muted futures market as speculation eased.
The Swissblock trend indices reflected a change in dynamics in the crypto market, with bitcoin gaining strength against altcoins.
The bitcoin-to-ethereum spot traded volume ratio skyrocketed while the ETH/BTC tanked.
It is likely that the worst has passed, the hefty liquidity should withstand further selling pressure.
State of the system
This week’s price action revolved heavily around the FOMC meeting, investor sentiment towards the Fed’s decision, and the 75bps rate hike, overshadowing fundamental crypto developments. Bitcoin dropped below $20k, again, with support holding tight. However, bearish momentum coupled with increased risk implies that we are not out of the woods yet (Figure 1). As we will explore below, both the monetary policy and regulatory fronts are offering nothing other than headwinds to crypto.
Figure 1: State of the system
Since our previous Uncharted - in which bitcoin’s momentum and trend were picking up and risk was decreasing (Figure 1, gray circle) - the price action has logged increased volatility. On September 13th, the price reverted and wiped out nearly all of the +15.89% run to $22.5k (Figure 2).
Figure 2: Sharp retrace to $18k support level
The downturn resembled a similar pattern noted around 8-10 days before the FOMC meetings this year (May, June, and July), whereby the price trended downward and rose after J Powell’s speech (Figure 3).
Figure 3: Bitcoin tends to underperform before FOMC meetings
After the May FOMC meeting, bitcoin saw the largest decrease as per the 5, 10, and 20 days following the previous meetings this year (Figure 4), followed by June. The earlier meetings in 2022 saw the most positive reaction, and July had a slightly positive, flat performance. Whether bitcoin will follow July’s trend reversion or extend the downward trend noted in May and June remains to be seen; however, near-term catalysts seem to be aiming to the downside.
Figure 4: Positive vs. negative reaction to FOMC meetings
Starting from a general overview of the state during the FOMC weeks, we can observe that all of the meetings this year have occurred in a high-risk environment (Figure 5), with the most pronounced risk in January. From another perspective, bullish momentum was only apparent during the March and July meetings.
Figure 5: High-risk bitcoin during FOMC meetings
The intensity of the bearish trend for bitcoin differentiates the most recent reading from the previous FOMC meetings (Figure 6). According to Swissblock’s Trend Index, the downward trend resembles the May 2021 crash, which extended for 3-months and saw a 53% retrace.
Figure 6: Forceful downward trend
The upward trend in traded volume in the spot market reinforced the significance of the Swissblock Trend Index reading (Figure 7). Whenever spot volume backs a downward trend, it tends to extend into the near future, and a reversion requires substantial buying pressure.
Figure 7: Spot volume-backed downward trend
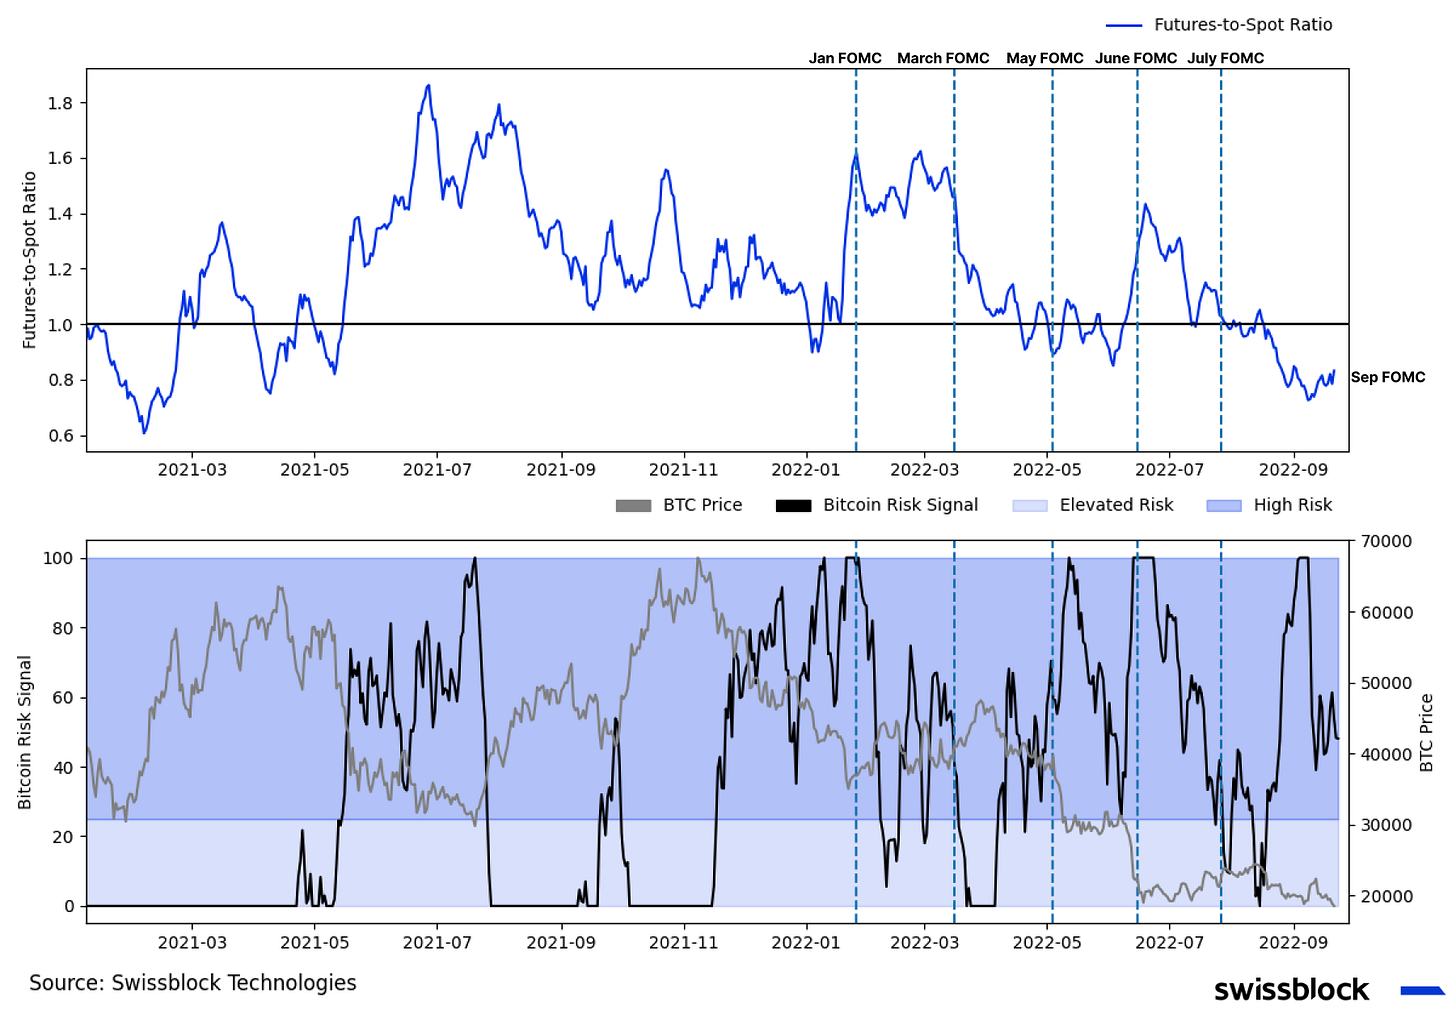
The futures-to-spot volume ratio is well below 1, and since the 50bps surprise rate hike in June, it has trended downward steadily (Figure 8). This development indicates less confidence and speculation in the system, as the Swissblock Bitcoin Risk Signal struggled to stabilize and cross below the elevated-risk zone.
Figure 8: Dominant spot market reflects dampened investor sentiment
It is interesting to note that when the Swissblock Bitcoin Risk Signal decreased or peaked before the January, March, and July FOMC meetings and dropped to the elevated-risk zone after, which led to positive returns in the subsequent days (Figure 9). From another perspective, the Swissblock Bitcoin Fundamental Signal crossed the bearish zone after the May FOMC meeting until July.
Figure 9: Will the Swissblock Bitcoin Risk Signal cross to the elevated-risk zone?
Breaking down the state of the crypto market
According to J Powell’s remarks, a subsequent 75bps rate hike, previous FOMC weeks, and the state of the system, bitcoin likely continues to trade in the $17-$25k trading range (Figure 10). Even though the spot market saw an uptick in traded volume, the options and futures market denoted selling pressure amidst a high-risk and bearish regime (Figures 1 and 7).
Figure 10: The everlasting trading channel ($17-$25k)
From a futures market perspective, the muted funding rates since the beginning of 2022 reflected the level of uncertainty in the market (Figure 11). With another vague and ambiguous message from J Powell and an increasingly sluggish, slowing economy, the futures open interest rate of change has turned negative. This further delays any potential trend reversal.


