


Dear subscribers,
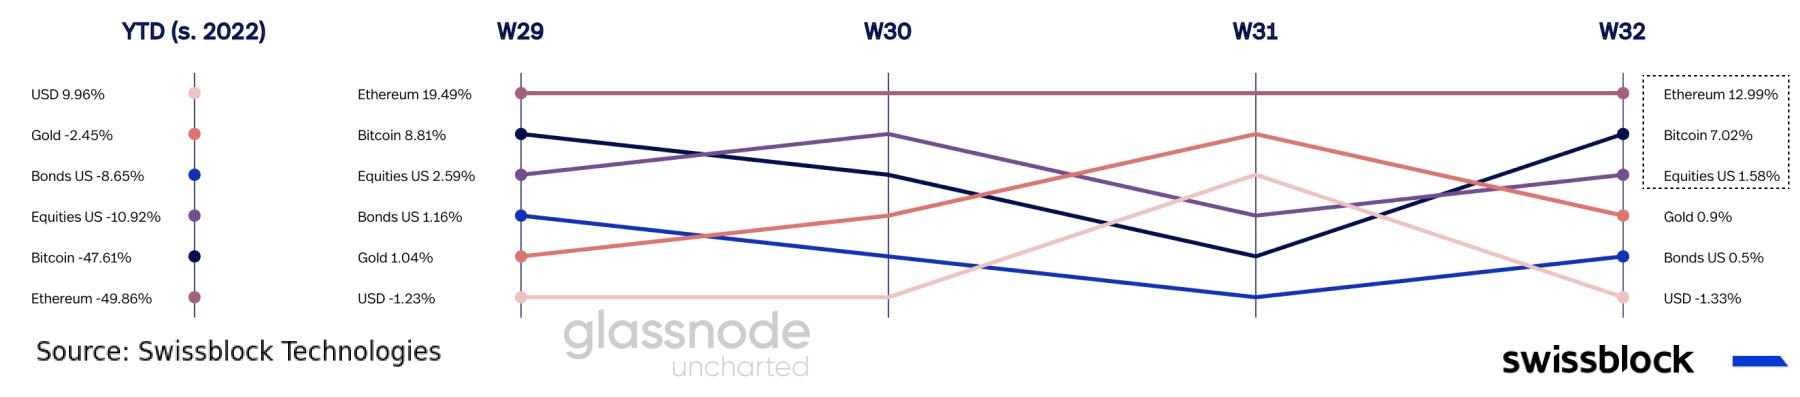
Bitcoin kicked off Q3 22 with the best month (+17.7%) since October 2021. Momentum is gaining as the price retests the resistance level of a highly liquid trading channel. Markets showed signs of a renewed sentiment seeing the first innings of a decelerating inflation rate. Investors are taking on more risk and divesting into riskier assets extending the Altcoin Season.
Let’s dig in!
TL;DR
Bitcoin outperformed as markets bet on a more lenient Fed, pressuring the price action to the upper range of the trading channel.
The July CPI report came in lower than expected due to the decrease in energy prices and slowing in core services.
Inflationary pressures can reignite in light of global supply shocks and a tight labor market.
Bitcoin on and off-chain volume decreased in July, and a decrease in stablecoin market cap implied capital flowing into play.
Altcoin season remains in full throttle as investors divested to riskier altcoins in a lower-risk environment.
Ethereum outperformed bitcoin as Swissblock’s Bitcoin Risk Signal depicted a subsiding risk of a pronounced drop.
Bitcoin is becoming less sensitive to incoming macroeconomic data driving its relative volatility to the S&P 500 and US bonds lower.
Fears dissipating
Following the worst Q2 in bitcoin’s history (-56.7%), bitcoin, amongst other asset classes, showed decisive price action in consequence of speculation of a more lenient Fed over promising inflation prints.
Figure 1: Risk-on assets recovered in light of renewed sentiment
The July CPI report signaled a peaking inflation rate as Wednesday’s print was lower than expected (CPI 8.5% YoY vs. 8.7% expected). After three consecutive months of increasing inflation rates (Figure 2), investors saw the first innings of easing inflationary pressures.
Figure 2: Easing inflationary pressures

The positive news led to an abrupt change in target rate probabilities for the September FOMC meeting. The market priced a 75bps rate hike at 68% before the CPI print and decreased to 42.5% afterward. Bitcoin’s price trend regained strength (Figure 3), following its close relationship to rate hike expectations.
Figure 3: Investors betting on a more lenient Fed
Breaking down the CPI report, it becomes clear that the slowdown in inflation was more likely due to the topping energy commodity prices, which decreased by -7.6% month-over-month according to the July CPI report. Notice how the 12-month percentage change in energy decreased month-over-month while the food subindex increased (Figure 4).
Figure 4: Topping energy prices pushed inflation down
Here is another view of topping energy commodity prices (Figure 5).
Figure 5: Brent and Crude Oil down -16% and -20%, respectively, since the mid-June peak

When excluding food and energy due to their volatility and focusing on core CPI, we can observe there is potential for the decreasing trend to extend. Services, which are more sensitive to wages and business cycles, slowed dramatically to September 2021 levels (Figure 6).
Core CPI vs. CPI: core CPI excludes food and energy, which are more volatile.
Figure 6: Wage-sensitive core services inflation decelerated
The decrease in core services is more likely due to a dampening demand (see Uncharted #19) due to higher borrowing costs rather than easing wage pressures. Notice how the imbalance between supply and demand in the labor market remained at an alarming level (Figure 7). Bear in mind that last week’s nonfarm payrolls (528k vs. 250k expected) imply that businesses hired more employees than expected, which can push wages higher.
Figure 7: Tight labor market can push wages higher

In other words, it is too early to tell whether inflation will continue to decrease. Supply shocks around the world continue to pressure commodity prices higher. Take China’s disappointing PMI print (49) due to the lowest factory output since mid-2020. If the labor market remains tight and wages increase, the increase in demand will push prices higher in light of less supply in the US and elsewhere (Figure 8).
Figure 8: Global supply shocks can reignite inflationary pressures

Direction in the crypto market
Bitcoin has reacted strongly to the renewed sentiment across markets. The price retested the resistance level of the $17-$24k trading channel as Swissblock’s Bitcoin Risk Signal denotes a decreasing risk of a pronounced drop (Figure 9).
Figure 9: Bitcoin retesting the $24k resistance level
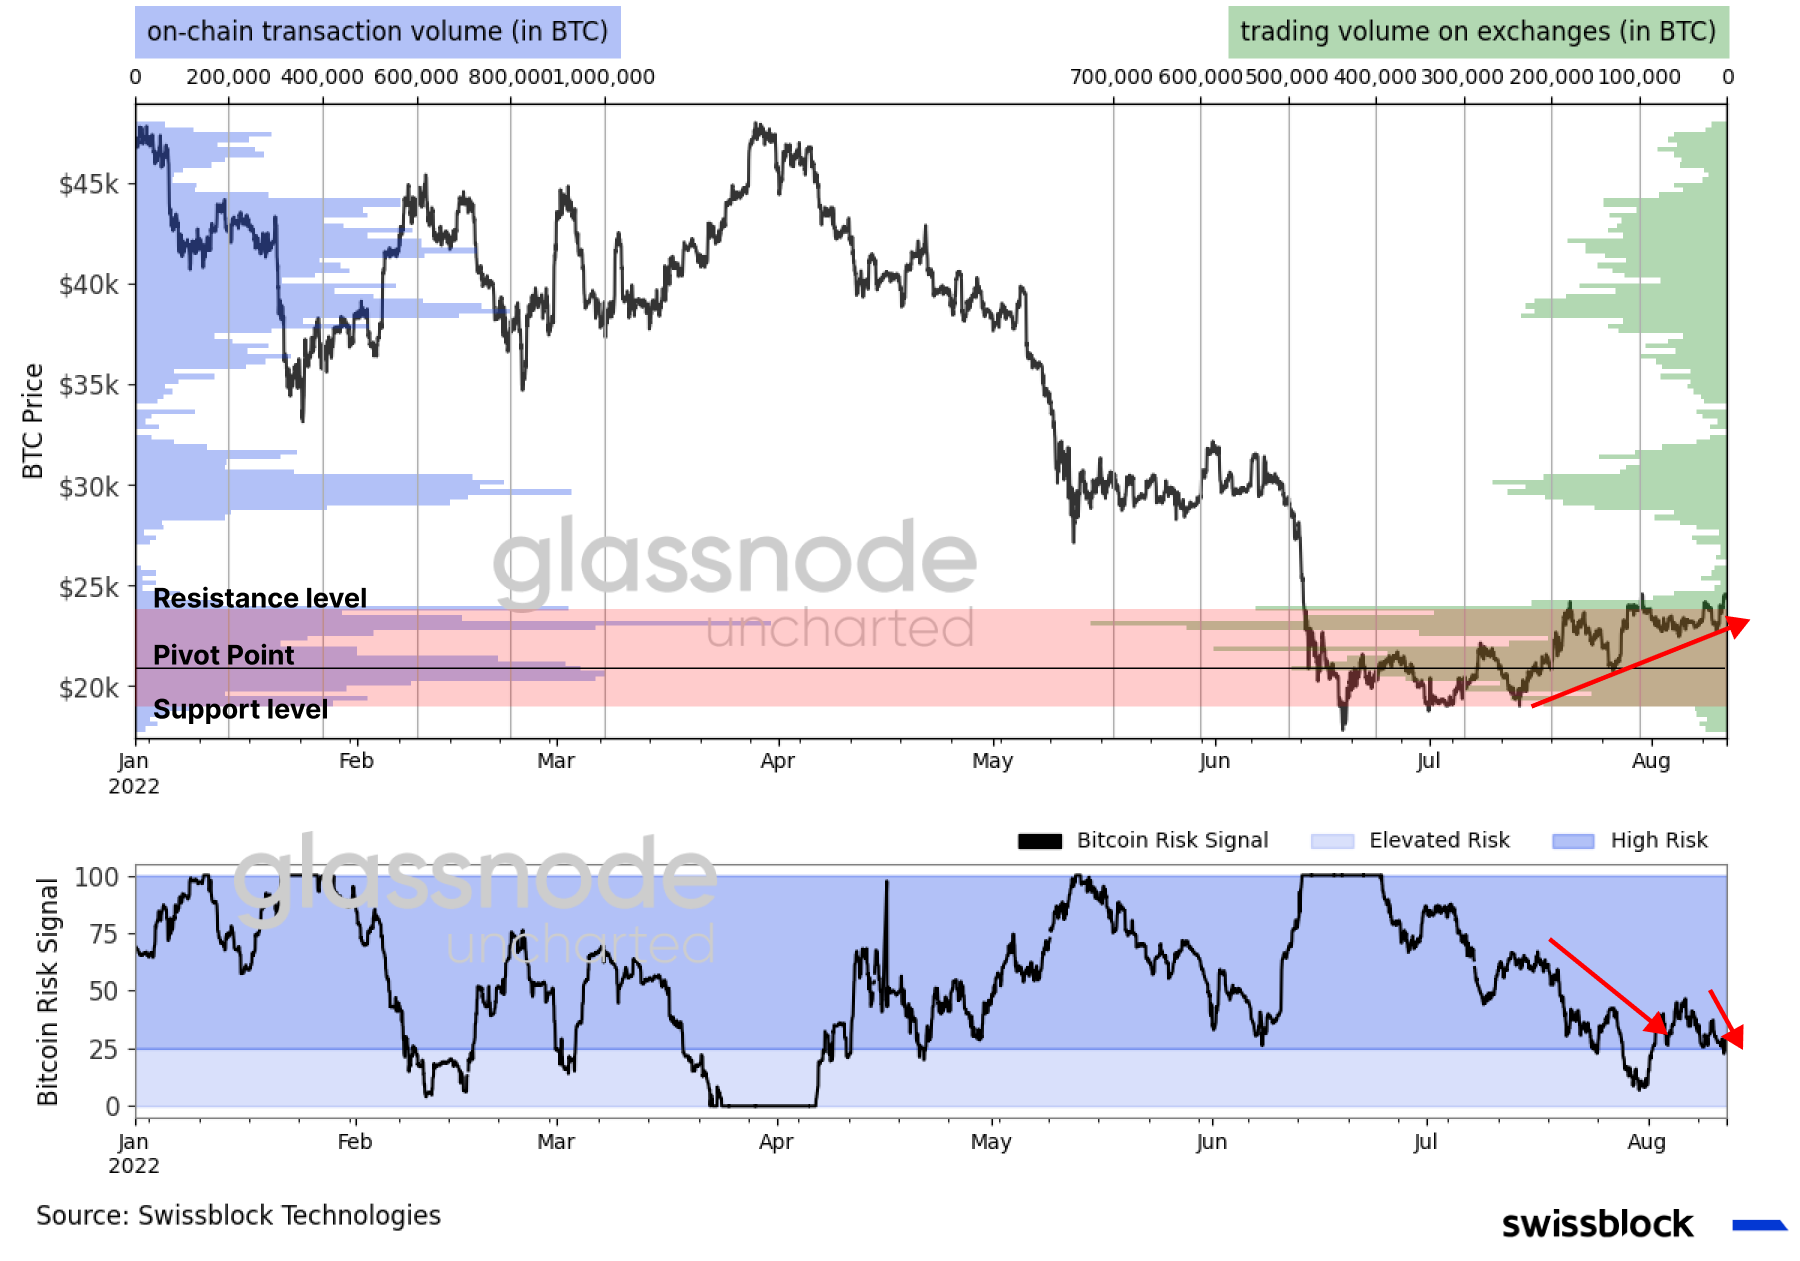
A break above higher levels in a highly liquid channel (Figure 9, red area) will require substantial momentum and a sustainable trend. At the moment, it appears that despite a lower stablecoin market capitalization with respect to bitcoin, on-chain volume depicted less demand in July (Figure 10).
Figure 10: Bitcoin on-chain total transfer volume decreased by 41% in July
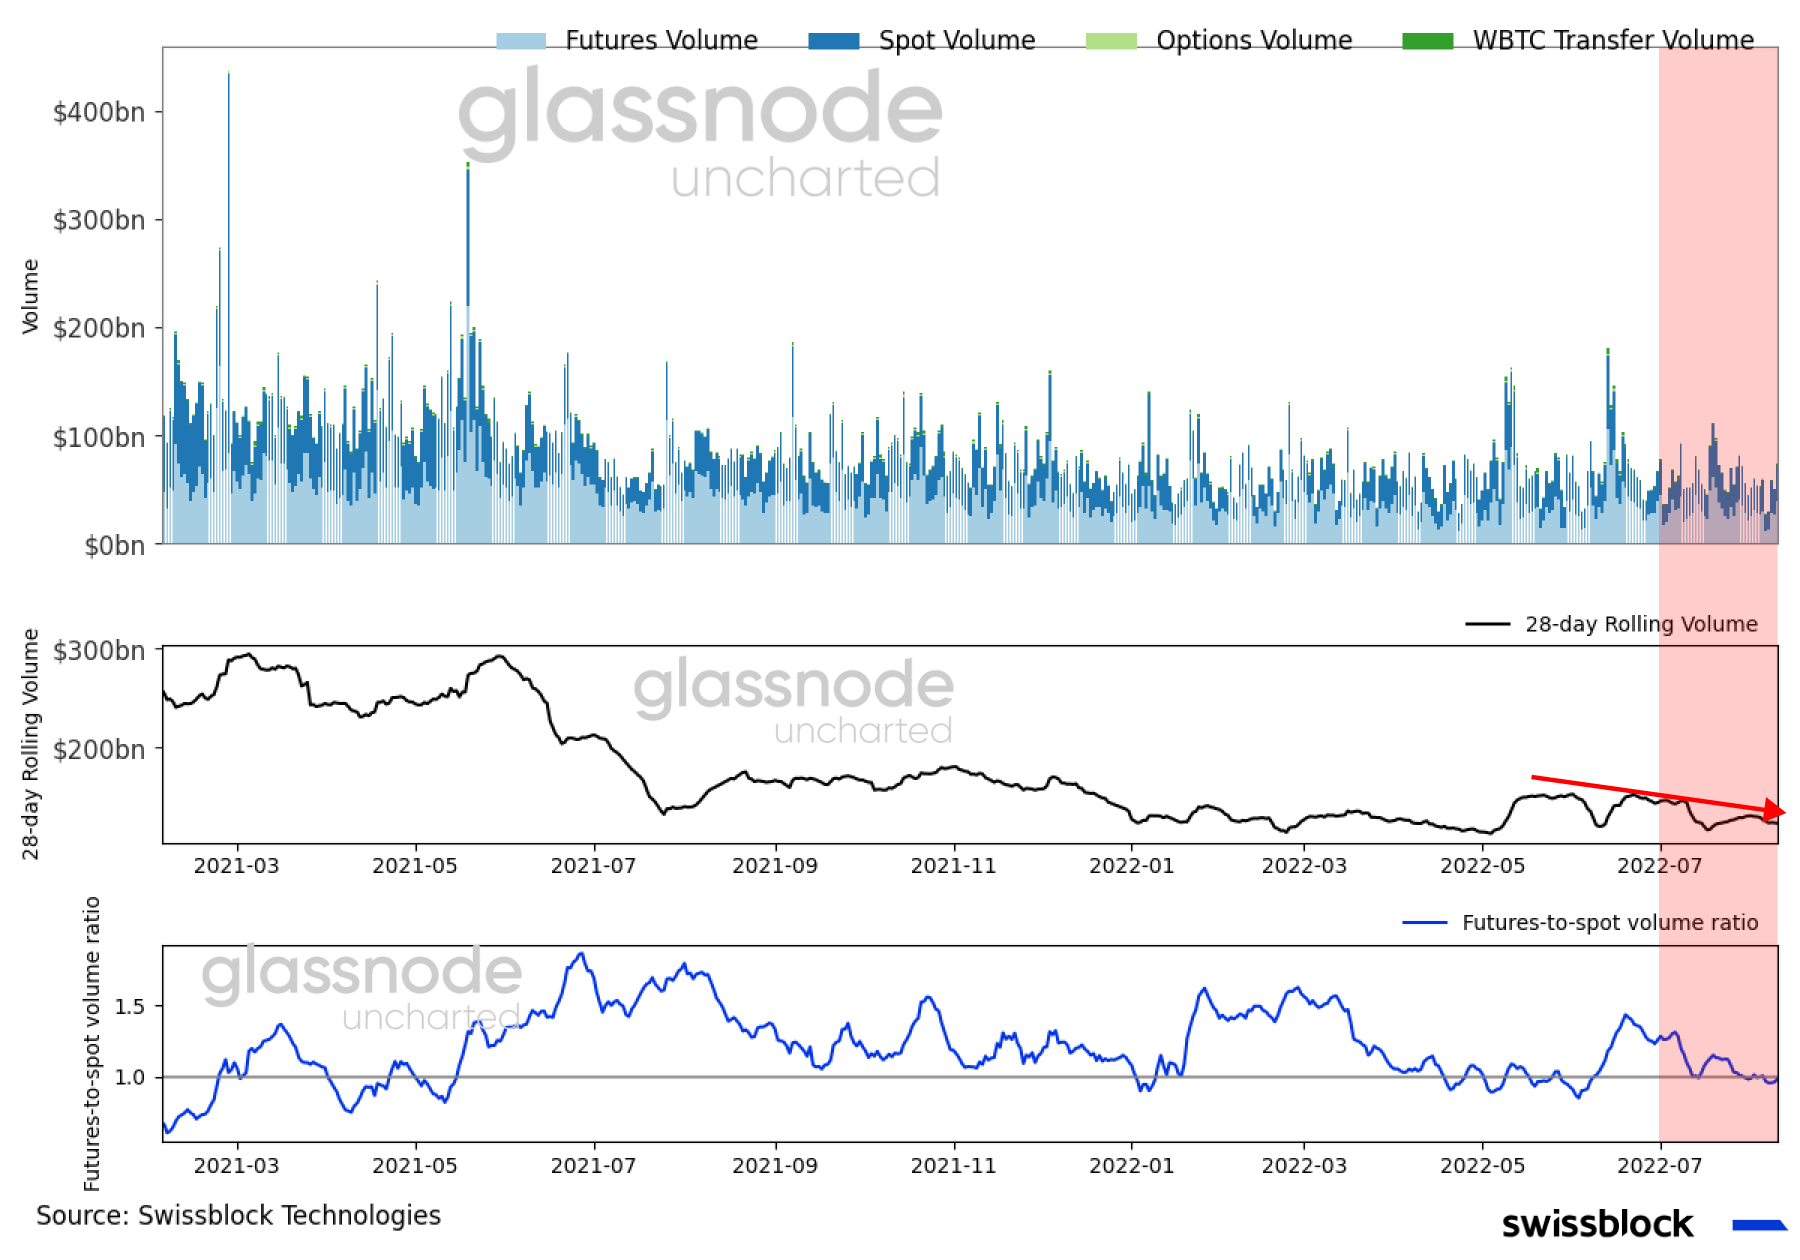
From an off-chain perspective, we can see a similar picture of shy demand. Notice how the traded volume has dramatically decreased in an ongoing trend depicted by the 28-day rolling volume (Figure 11). On the bright side, the decreasing futures-to-spot volume ratio reflected stronger demand for spot bitcoin, which is key for a sustained upward move.
Figure 11: Interest turned to the spot market
According to Swissblock’s Altcoin Cycle Signal, some of bitcoin’s force tempered as investors divested into altcoins in a lower-risk environment. Since ethereum’s merge became clearer, ethereum has outperformed bitcoin, driving altcoins higher (Figure 12).
Keep reading with a 7-day free trial
Subscribe to Swissblock Insights to keep reading this post and get 7 days of free access to the full post archives.