


Dear subscribers,
Bitcoin has shown decisive price action as investors process incoming data suggesting an economic downturn. In light of the Fed's restrictive stance to fight inflation, the positive news is translated into bearish sentiment, while negative information drives the market. How are crypto investors reacting toward the charged macro-environment?
Let’s dig in!
TL;DR
Decisive price action has led bitcoin to retest the $21k resistance level and a shift of support towards $19k.
Selling pressure subsided as on-chain data suggested accumulation and saving behavior.
Lack of liquidity on exchanges and lower traded volume have driven bitcoin’s intraday volatility.
Investors are back-and-forth on the fears of recession and inflation as they await the FOMC meeting.
Decreasing consumer sentiment and business expectations indicated the first innings of economic slowdown.
Higher initial jobless claims and decreased job openings are expected to reduce pressure on input prices.
Swissblock’s Bitcoin Risk Signal indicated an easing risk of a pronounced move as the market priced in a potential end to the Fed’s restrictive policy.
Investors back-and-forth between recession and inflation fears
In a volatile environment where bad news is perceived as good news, bitcoin has been compressed between $19-$21k while Swissblock’s Bitcoin Risk Signal reflected an easing risk. Despite a weak price action in June, there is an impending pronounced move. The market is indecisive as investors digest incoming data, eagerly await the FOMC meeting, and anticipate the Fed’s policy.
Figure 1: Bitcoin testing the $21k resistance level
Will the Fed proceed with an aggressive rate hike in July and September? Or has the economy (aggregate demand) shown enough weakness to persuade the Fed to change its course of action? We break down the state of the economy to further understand the Fed’s position. All our focus turns to aggregate demand.
AD = C + I + G + (X-M)
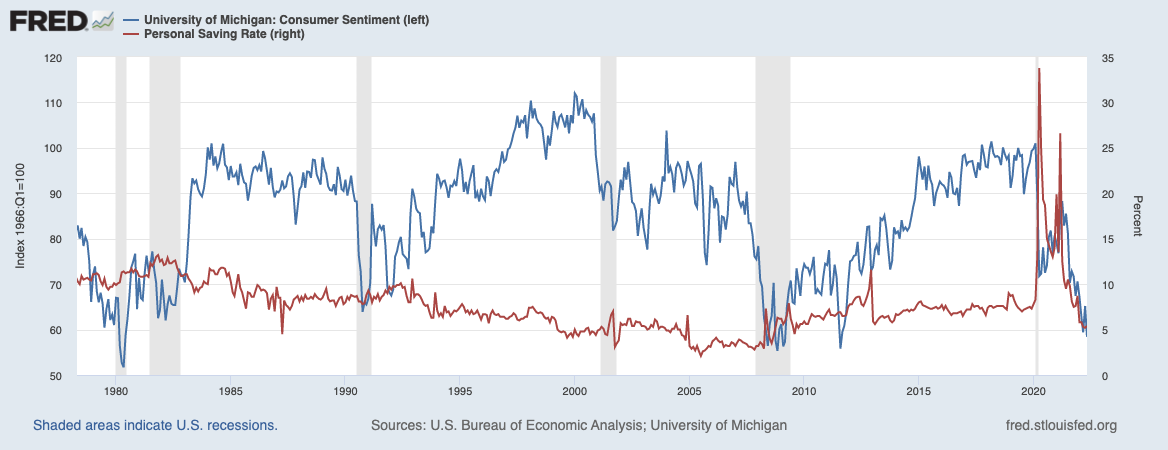
We kick off with consumption since it is the most influential factor, representing around 70% of the US economy. Consumer confidence - a leading indicator used to determine how aggressive consumers may be in their spending - decreased in the month of June to levels not seen since 2011 (Figure 2).
Figure 2: Consumer confidence lower due to inflationary pressures
However, consumer confidence does not reflect actual consumer behavior; thus, we analyze it alongside retail sales - a coincidental indicator - to grasp the true strength of the consumer. The figure below reflects peaking sales due to a higher propensity to save from a consumer perspective.
Figure 3: Consumers cut back on spending

The conservative appetite is potentially due to the reduced household wealth and bearish sentiment. Notice how real disposable income has decreased to its trend as inflation erodes more after-tax income, and a surge in supply in the housing sector pressured the real estate price downward (Figure 4). Both key factors of household wealth and consumer confidence.
Figure 4: Household wealth taking a hit

The month-on-month change in durable goods, excluding defense, new orders beat expectations yet came out at low levels for May. Figure 5 reflects a greater demand for non-durable goods than durable goods, reinforcing a potential weakness in consumption. During economic downturns, households postpone replacing items with longer useful life and a bigger ticket.
Figure 5: Consumption focused on non-durable goods

As demand weakened, businesses’ inventories piled up (see Uncharted #18: Inflation Extension), which could lead to an increase in the inventories-to-sales ratio (Figure 6). A rise in the said ratio implies a decrease in business investment, which weakens the economy as seen in the aggregated demand formula.
Figure 6: Business inventories down on lower consumption

Given that the inventories-to-sales ratio is a lagging indicator that changes direction once the recession or expansion is already underway, we turn our attention to the ISM Manufacturing PMI - a leading indicator - to determine whether we can anticipate a decrease in business investment. The index decreased 3.1% in June and is edging towards 'no man’s land' (50). The recent index print of 53 implied an ongoing expansion (Figure 7), yet it is the lowest reading since June 2020. A dip below 50 in July would imply a contraction...
Figure 7: The manufacturing sector suggested a robust economy

Government expenditures contracted in Q1 2022 for the fourth consecutive quarter (Figure 8). The billions of dollars given to Ukraine are incomparable to the government expenditure in 2020. From a local or state perspective, government spending was among the positive contributors to real GDP growth in Q1 2022 (Figure 8). However, the current sum may not be enough to thrust aggregate demand, especially considering that Democrats are expected to lose Congress later this year. The next round of stimulus could be seen as late as 2025.
Figure 8: Government expenditure recorded a 4th consecutive decrease

The most recent trade balance (Figure 9) data suggests that imports started to decelerate following April’s peak in light of a strong dollar (we will expand on this point later in the Uncharted), as exports began to increase. The increase in the trade balance reflected the first signs of decreasing domestic demand.
Figure 9: Trade balance remained deeply in the negative

Considering the abovementioned, we can infer an economic downturn. Consumer confidence is low alongside demand, business investment decreased, government spending followed, and the trade balance showed a lower domestic income. All indications of a peak in the business cycle and a looming recession.
How are crypto investors reacting?
Even though bitcoin has compressed within the $19-$21k support level, the risk of an abrupt move persists as incoming data causes the price action to pivot aggressively. The hefty liquidity, noted in Uncharted #18, contained volatility from butchering the said level. Yet the intraday volatility suggested that investors and the price action are susceptible to incoming data released during official trading hours (Figure 10).
