


Dear subscribers,
This Uncharted shows that the current market situation continues to be very delicate: GDP readings have continued to underwhelm, while the Fed seems intent on continuing its contractionary policy to buckle inflation. Bitcoin is setting up an attractive buying opportunity for those willing to stomach continued volatility.
Let’s dig in!
TL;DR
Bitcoin is forming a support level at around $28k with a resistance level at $32k.
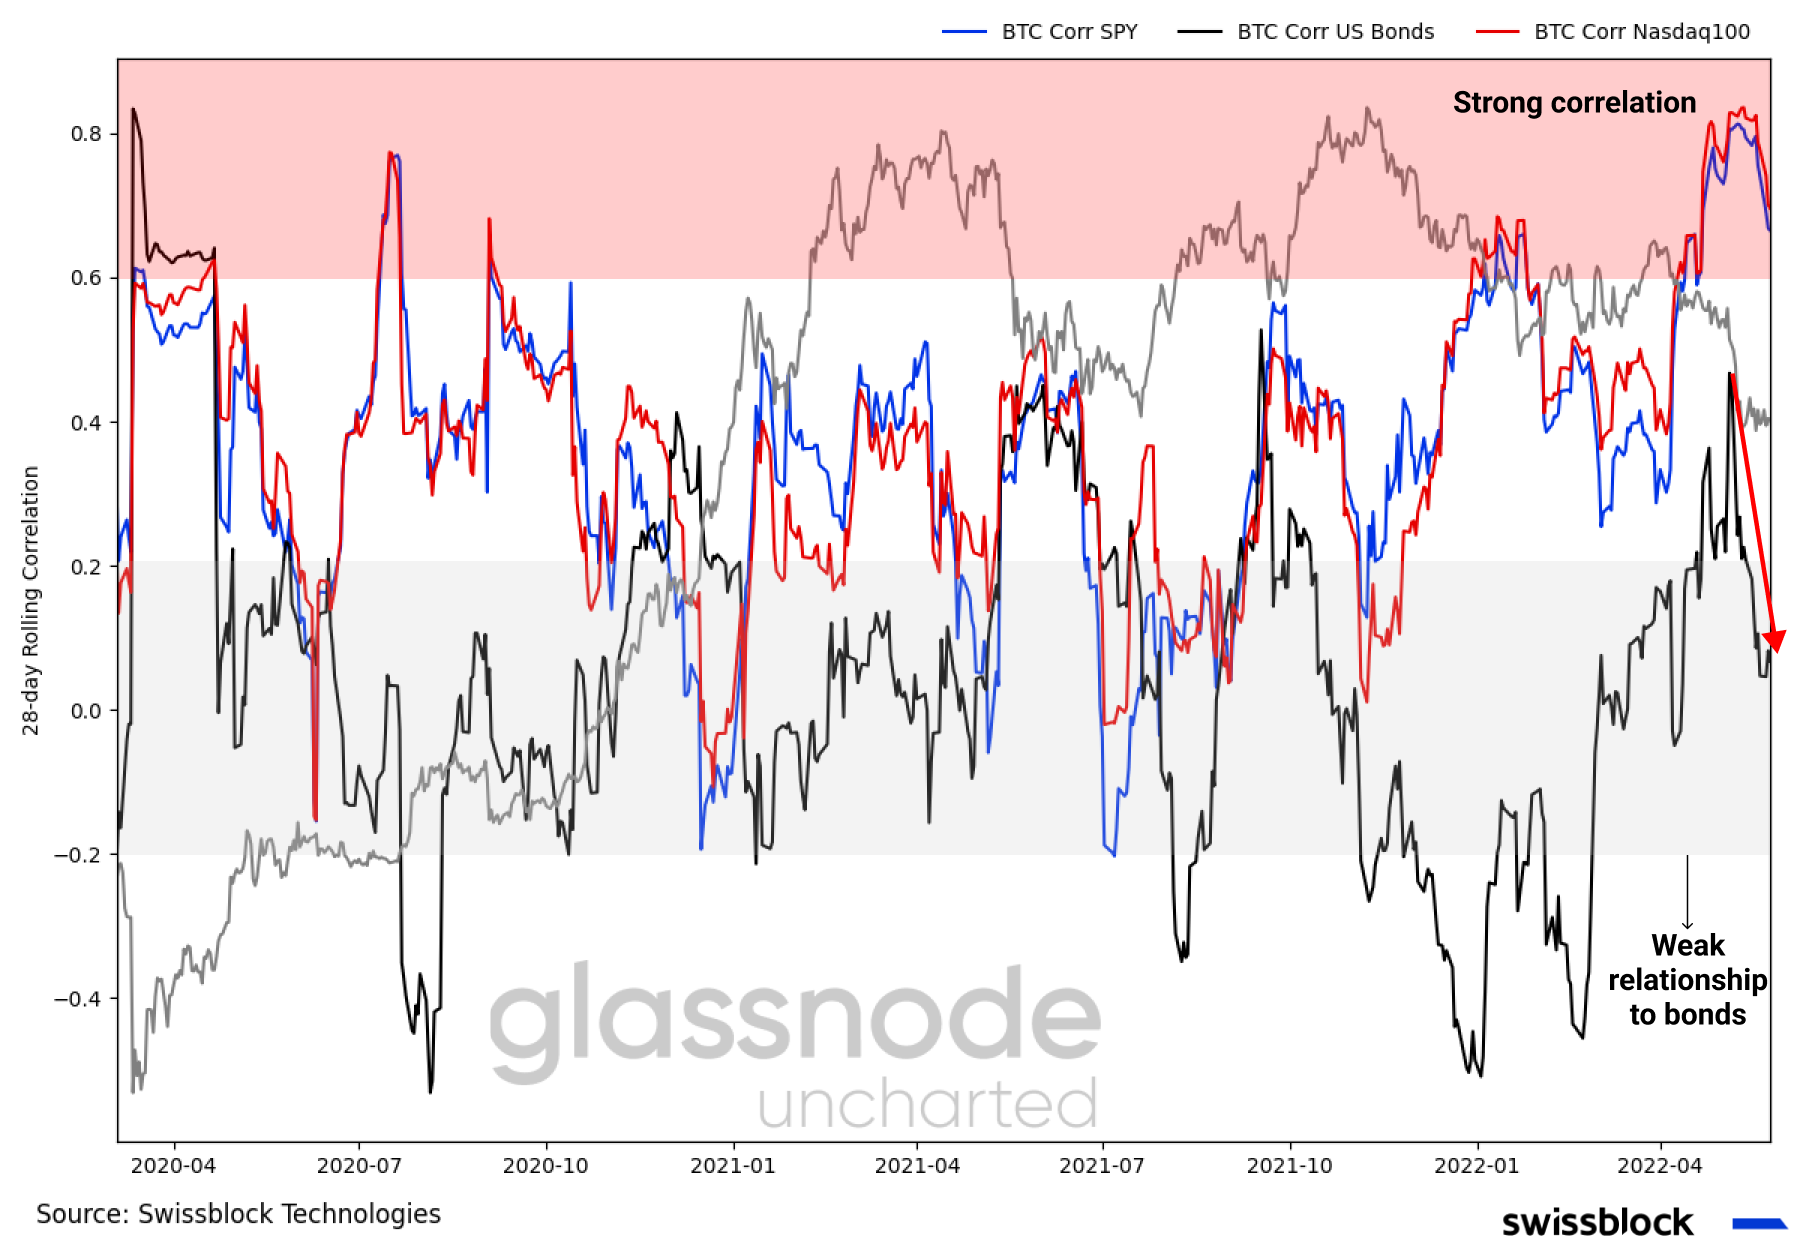
The correlation to US equities remained as bitcoin shows great sensitivity to the Fed’s course of action.
We expect ranging price action for the upcoming months with intense volatility, while investors digest impending macroeconomic data as the economy slows down.
On-chain suggested a potential bottoming and attractive buying opportunity seeing that seller pressure is exhausted.
Uncertainty and extreme fear endured, strengthening the demand for downside hedging in the options market.
Consumer sentiment decreased alongside a steeper than expected -1.5% fall in Q1 GDP QoQ. Swissblock’s proprietary signals indicated high-risk and a dominant bitcoin within the crypto space.
Bitcoin: A liquidity transfer mechanism
Bitcoin found support at around $28k following one of the bloodiest weeks for traditional markets. Swissblock’s Bitcoin Risk Signal reflected a decreasing risk as US equities are at the brink of a bear market (-20% from the ATH). The S&P 500 and the Nasdaq 100 logged their seventh consecutive losing week, while bitcoin marked its eighth.
Figure 1: Ranging price action

The risk of inflation may have already been priced in, yet selling pressure should endure seeing that high prices are beginning to affect consumers’ pockets and investor sentiment. Notice how retail sales decreased for the third consecutive month (Figure 2, left graph) alongside bank deposits (Figure 2, right graph), suggesting tighter budgets and less liquidity are leading to lower earnings and reduced appetite for risk-on assets.
Figure 2: Tighter consumer budgets

The breakdown of the S&P 500 by sectors showed a similar trend, in which the sectors that are more sensitive to rising prices and consumer spending underperformed alongside bitcoin (Figure 3, left graph). On the other hand, bitcoin seems to show the weakest correlations to year-on-year changes in the CPI for over three years (Figure 3, right graph), indicating that its recent highly correlated mode to risk-on assets may not be a long term phenomenon. It is also interesting to note that energy, traditionally a driver of CPI, has been decorrelated to this inflation metric since the onset of the pandemic.
Figure 3: Return sensitivity to rising prices

The Fed’s course of action in response to higher prices and a potential engineered recession became the main focus. Gold and the US T-bond’s weekly rank progress suggest increased flows to safe havens potentially due to a risk-averse rebalance. However, following a slightly more dovish Fed earlier this week and speculation of a lenient course of action towards Q4 of this year, US equities made a comeback and outperformed in week 21 (Figure 4).
Figure 4: Weekly ranking - US equities outperformed

We believe that investors have not considered bitcoin as a hedge against inflation, given that bitcoin is trading at par with risk-on assets rather than a haven. Bitcoin decoupled from the US T-bond while the ties to US equities remained within the “strong” zone (Figure 5, red area). It seems like bitcoin, along with equities, is set to see its next leg upwards when the Fed pauses its current contractionary efforts: In the May 25th Fed minutes, it is hinted that such a pause may occur around September. Along this line, the news that 75 bps rate hikes were unlikely was already received warmly by equities.
Figure 5: Bitcoin decoupled from bonds
Since two further significant rate hikes of 50 bps are lined up over the next two months, investors will continue to liquidate risk-on assets, like bitcoin, and rotate into gold. In fact, bitcoin has lost -58% of its gold purchasing power since November 2021 all-time high, and is at the 2017 significant level (Figure 6).
Figure 6: Digital store of values vs. the original store of value

We believe that the bitcoin/gold ratio, comparing the digital store of value and the original store of value, could cross below the significant support level since the price action has been historically sensitive to the Fed’s monetary policy. Notice how bitcoin has underperformed during contractions and outperformed in expansions (Figure 7).
Figure 7: A liquidity transfer mechanism
This shows that while bitcoin has struggled to position itself as an inflation hedge so far, it has consistently proven to be a liquidity transfer mechanism: It has allowed for value to flow between traditional markets and the wider crypto ecosystem. Ultimately, the two consecutive 50bps hikes expected for the June and July FOMC meetings have been priced in by the markets, which has pressured bitcoin and other risk-on assets.
An attractive, yet volatile entry point
Bitcoin, like other assets, is facing intense selling pressure from panicking investors; however, the price action that pushed bitcoin below $30k in early May staggered as bulls fiercely fought the downward pressure. Consequently, network activity increased as more supply changed hands while the network shed value (Figure 8). This phenomenon has historically signaled a great buying opportunity.
Figure 8: Bitcoin’s “price-to-earnings” ratio
When comparing market capitalization and dormancy, it becomes apparent that after the selloff - noted in Uncharted #15 - the number of coin days destroyed increased. However, in bitcoin’s past, whenever the entity-adjusted dormancy flow consolidated within the buy zone (Figure 9), it suggested a bottoming due to easing selling pressure encouraging investors to buy at a discount.
Figure 9: Easing selling pressure encouraged buying at a discount
The risk of a capitulation, or intense selling that could floor the price below $28k, subsided as the short-term holder profit/loss ratio reverted (Figure 10). Notice how the price reverted when the said ratio has been around current levels, as less supply in loss led to less panic selling.
Figure 10: Less supply in loss mitigates the risk of panic selling
In other words, short-term seller exhaustion decreases as the supply in profit is at low levels, and the price action is less volatile (Figure 11). Bear in mind that high volatility coupled with a significant share of supply in profit encourages short-term holders to panic sell.
Keep reading with a 7-day free trial
Subscribe to Swissblock Insights to keep reading this post and get 7 days of free access to the full post archives.