Dear subscribers,
In this edition of the Uncharted, we deep dive into the systematic selloff that drove bitcoin below $30k. All in the context of the May 16th FOMC meeting and the potential course of action the Fed may employ to fight the rising inflation.
We kick off by analyzing the US bond selloff spreading into riskier asset classes in a period where rising inflation pressures the Fed. After, we break down the precarious macroeconomic environment and its effect on crypto investors’ sentiment and behavior. Focusing on selling pressure in the spot and futures markets alongside on-chain holding behavior. We conclude by positioning ourselves for the near term using Swissblock’s proprietary signals under extreme fear in the market.
Let’s dig in!
TL;DR
Bitcoin dropped below $30k as inflation fears and tightening monetary policy rattled markets.
The correlation between bitcoin and the S&P 500 hit unprecedented levels as the US bond selloff spread to risk-on assets.
Bitcoin logged $45 million in inflows while $3 billion in assets were pulled out of US equities.
On-chain transaction volume increased to 2017 levels with a 45 million bitcoin transaction volume this week.
A reduced buying power was offset by holding behavior as unrealized losses exceeded realized losses.
The accumulated bid transactions reflected intense selling pressure in the spot and futures markets.
Over $1 billion in positions got liquidated this week and the risk of further liquidations persists as crypto-margin-backed futures open interest increased.
Hedging behavior in the options market drove the price of puts higher in light of disappointing CPI prints.
Extreme fear drove the crypto market as Swissblock’s Bitcoin Risk Signal is near the extreme (100), and altcoins take the biggest hit.
Rapid selling of bonds
Ahead of the May 16th FOMC meeting, Swissblock’s Bitcoin Risk Signal indicated an escalating risk as the price action retested significant liquid levels (Figure 1, red area A) but soon plummeted below $30k due to a lack of support and pronounced selling pressure. A new significant price level is forging around $26-$32k (Figure 1, red area B).
Figure 1: Significant price level forging around $26-$32k

The ongoing bond selloff spread to risk-on assets as the Fed transitioned to a contractive stance (Figure 2, red area and arrows), as noted in our previous Uncharted’s.
Figure 2: Bond selloff spread to risk-on assets

The flattening inflation rate YoY (Figure 4) should ease the selling pressure for bonds and other asset classes. Traditionally, a flattening inflation rate has encouraged the Fed to be more lenient and avoid quantitative tightening, which has resulted in less abrupt hikes and a consequent rise in bonds and other asset classes dependent on discount factors (dividend yielding assets).
Now we are entering a similar regime as 1968-1975, where an increasing US 10-year maturity due to high inflation pressured the S&P 500 downward (Figure 3). Notice how the S&P 500 deviated from the US 10-year maturity yield.
Figure 3: Diverging US T-bond yields and S&P 500
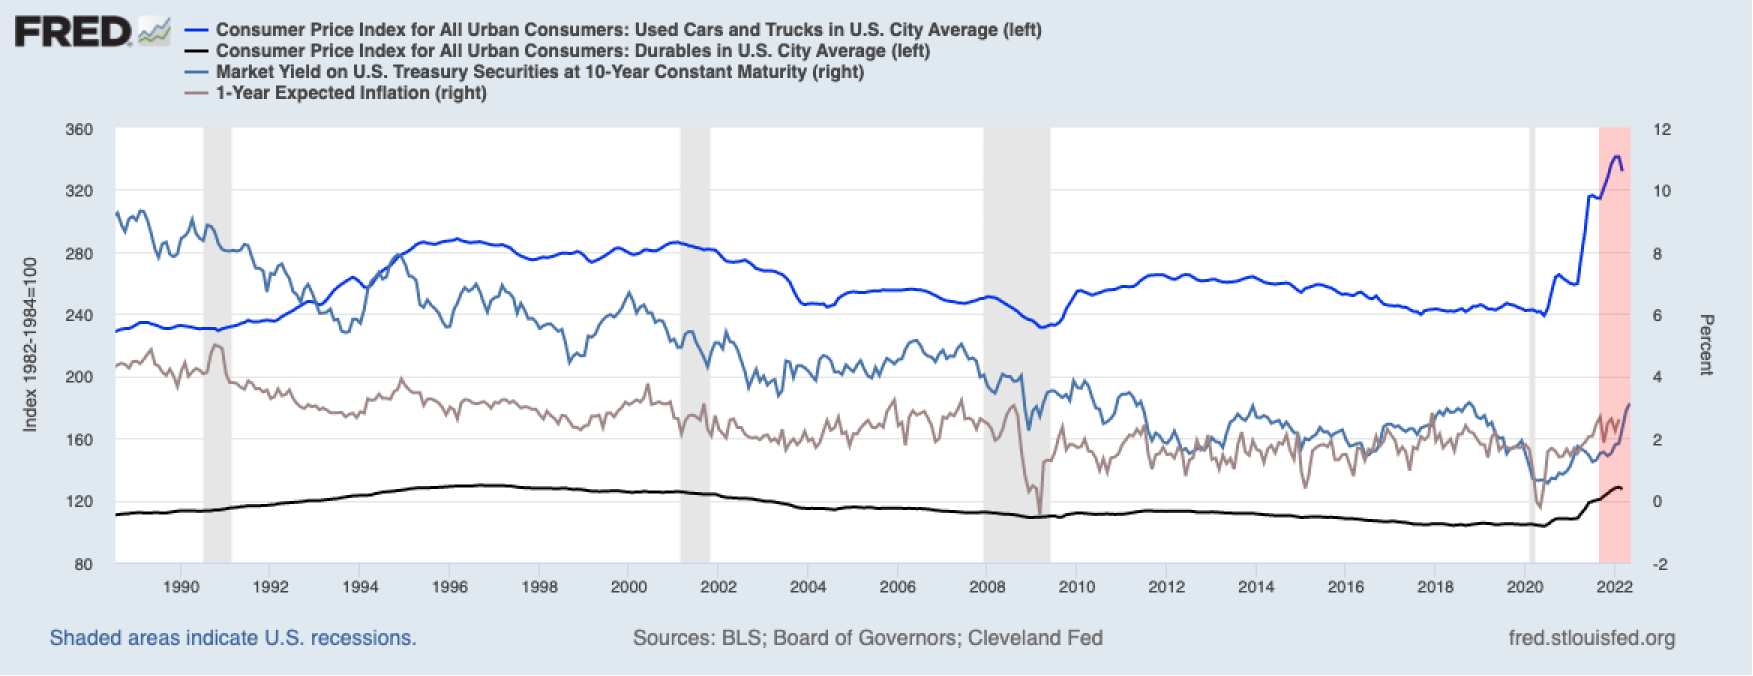
We believe that the Fed will continue adding pressure to the US 10-year maturity yield and the S&P 500, despite the fact that the prices of durable goods and used cars gradually decreased. The figure below shows that, since 1994, the said phenomenon was indicative of an easing inflation expectation, which pressured yields lower after the Fed tightened conditions.
Figure 4: Decreasing price of durable goods and used cars historically implies flattening inflation
High mortgage rates could worsen the economic condition if the Fed decides to accelerate its bond selloff as households dig deeper into their inflation-depreciated income to pay higher interests on more expensive houses (Figure 5).
Figure 5: High mortgage rates and expensive houses pressure the Fed’s tightening stance

It appears that financial conditions began contracting as the Chicago Fed’s National Financial Conditions Index trended from looser-than-average conditions (negative values) to tightening (upward trend edging towards 0) (Figure 6). When adjusting the said index to the recent negative GDP print (-1.4%), conditions look as if they were too loose. However, transitioning to tighter-than-average conditions could threaten the currently low unemployment rate (3.6% in the latest print).
Keep in mind that although the Fed’s dual mandate is to first ensure maximum employment and second maintain stable prices (by keeping inflation stable), currently Jerome Powell seems to be prioritizing controlling inflation, even if it causes “short term pain”.
Figure 6: Macro environment demanded tighter conditions

Investors priced a rate hike at a 95% probability in the upcoming FOMC meeting (June 15), reflecting the near-term bearish sentiment reinforced by last week’s fund flows (Figure 7). Following a week of inflows, nearly $3 billion were pulled out of US equities, while, at the same time, $3 billion flowed into US-fixed income securities (Figure 7, red areas). In the long run, however, we expect more capital to flow to US equities as a result of the US 10-year maturity yield approaching a significant resistance level around 3.05%, coupled with a strong dollar overshadowing non-USD denominated returns.
Figure 7: US fixed-income securities inflows dominated as net flows barely broke even

However, a different near-term crypto and bitcoin institutional sentiment was noted last week. A $45 million inflow into bitcoin and $4.8 million into altcoins offset the ongoing bearish sentiment for ethereum (Figure 8).
Figure 8: From $131 million in outflows to $45 million in inflows

We believe that bitcoin’s last week’s inflows (Figure 8) represent a boost in institutional newcomers’ confidence in bitcoin as a viable alternative investment. Bear in mind that in Uncharted #14, we noted a $131 million outflow. So, the question remains what the key driver behind bitcoin’s correction was.
On-chain disconnect from strained off-chain
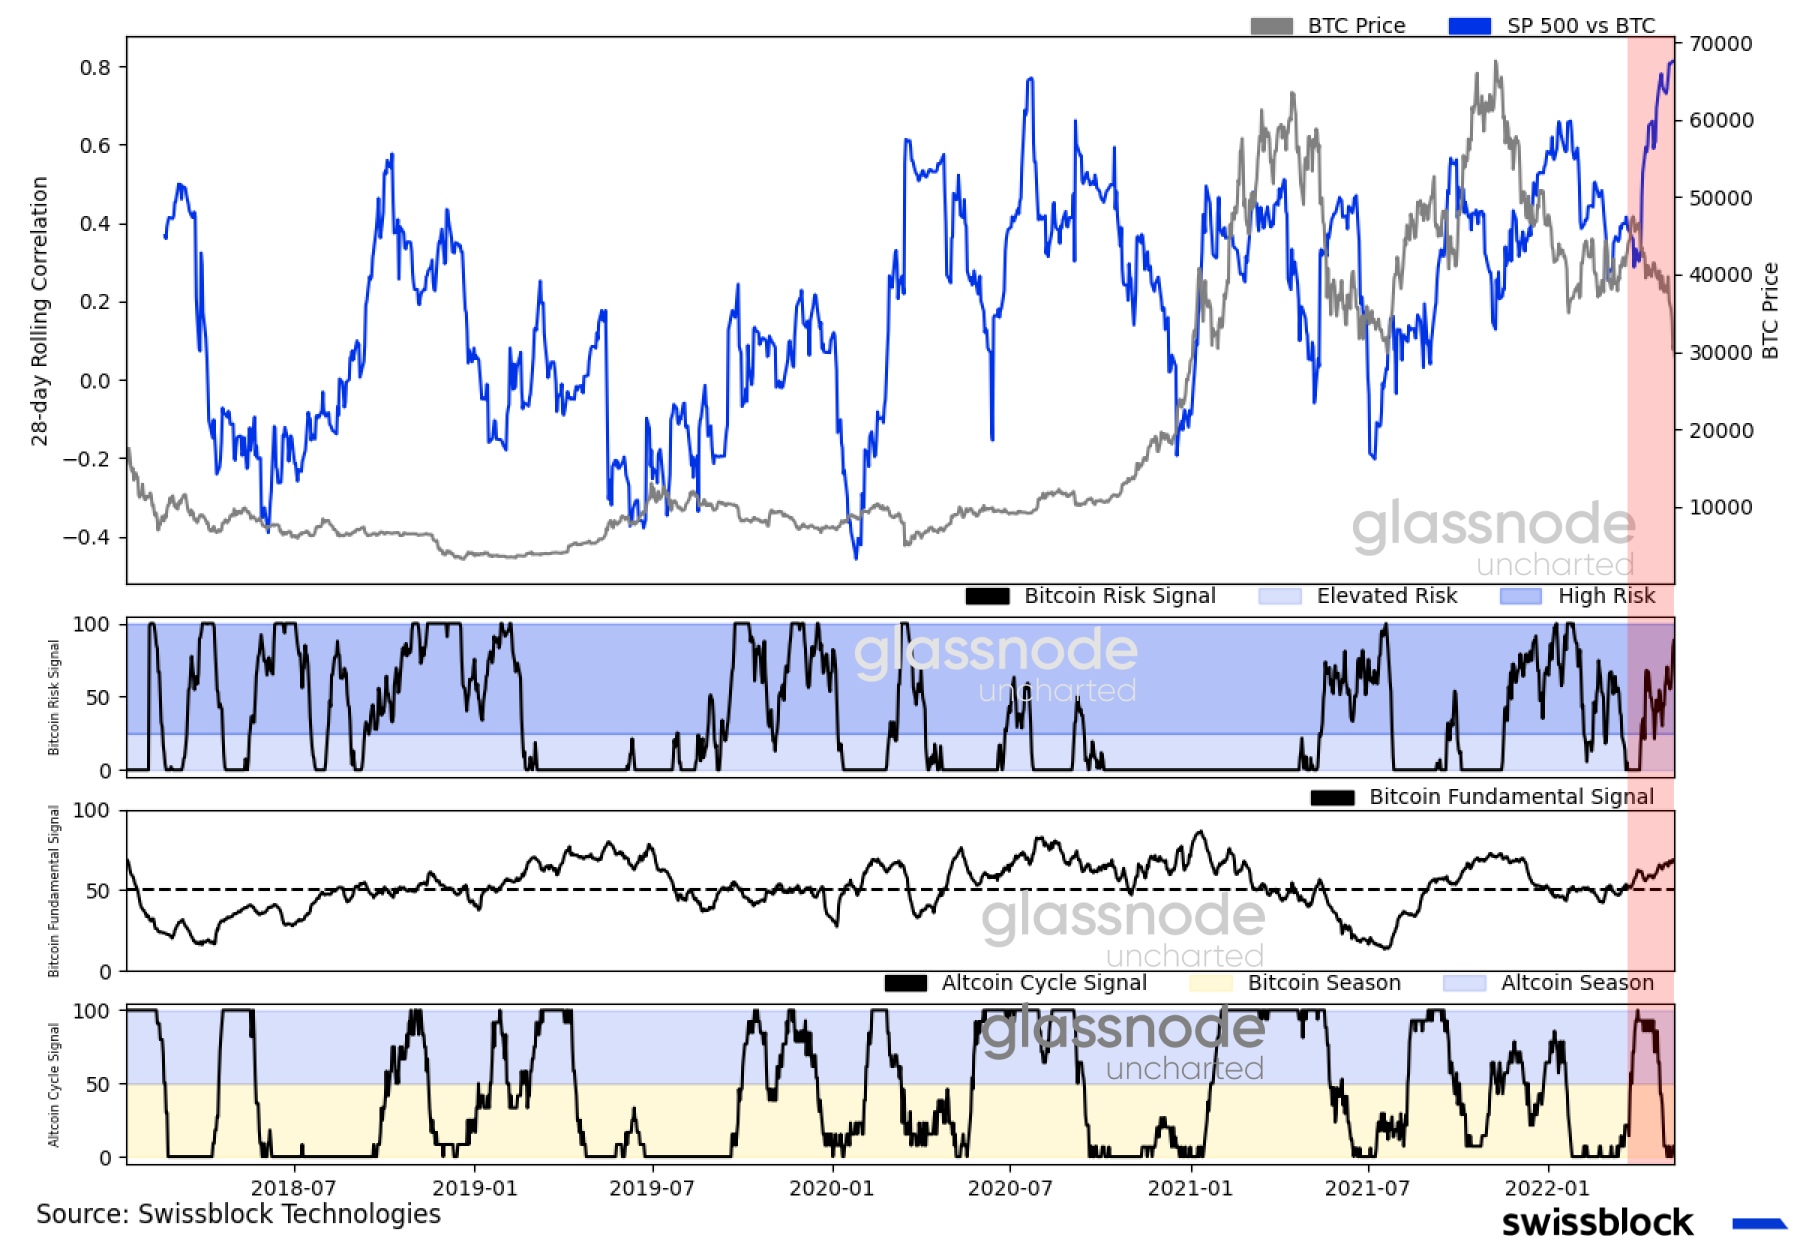
From a macro perspective, as the bond selloff turned systematic, the correlation between bitcoin and the S&P 500 soared to unprecedented levels (Figure 9, top graph). Swissblock’s Bitcoin Risk Signal began to show an increasing risk thrusting the Altcoin Cycle Signal deep into the bitcoin regime (Figure 9, second and fourth graph).
Figure 9: Sharp correlation between bitcoin and the S&P 500