


Dear subscribers,
In this Uncharted, we will focus on the renewed bitcoin and ethereum driven momentum in cryptos, exploring catalysts and analyzing on-chain and derivatives trading data to chart the path forward.
We will begin by looking at bitcoin’s rise in the context of a charged macro environment and analyze how it is performing versus the wider crypto space. We will also touch upon the significance of ethereum’s upcoming merge and explore further factors behind its price action today. After this, we will explore how spot trading has been a major driver of the current bitcoin rally and what this means for further price development. Towards the end, we will look at Swissblock’s proprietary signals and derivative metrics to better gauge the state of the market.
Let’s dig in!
TL;DR
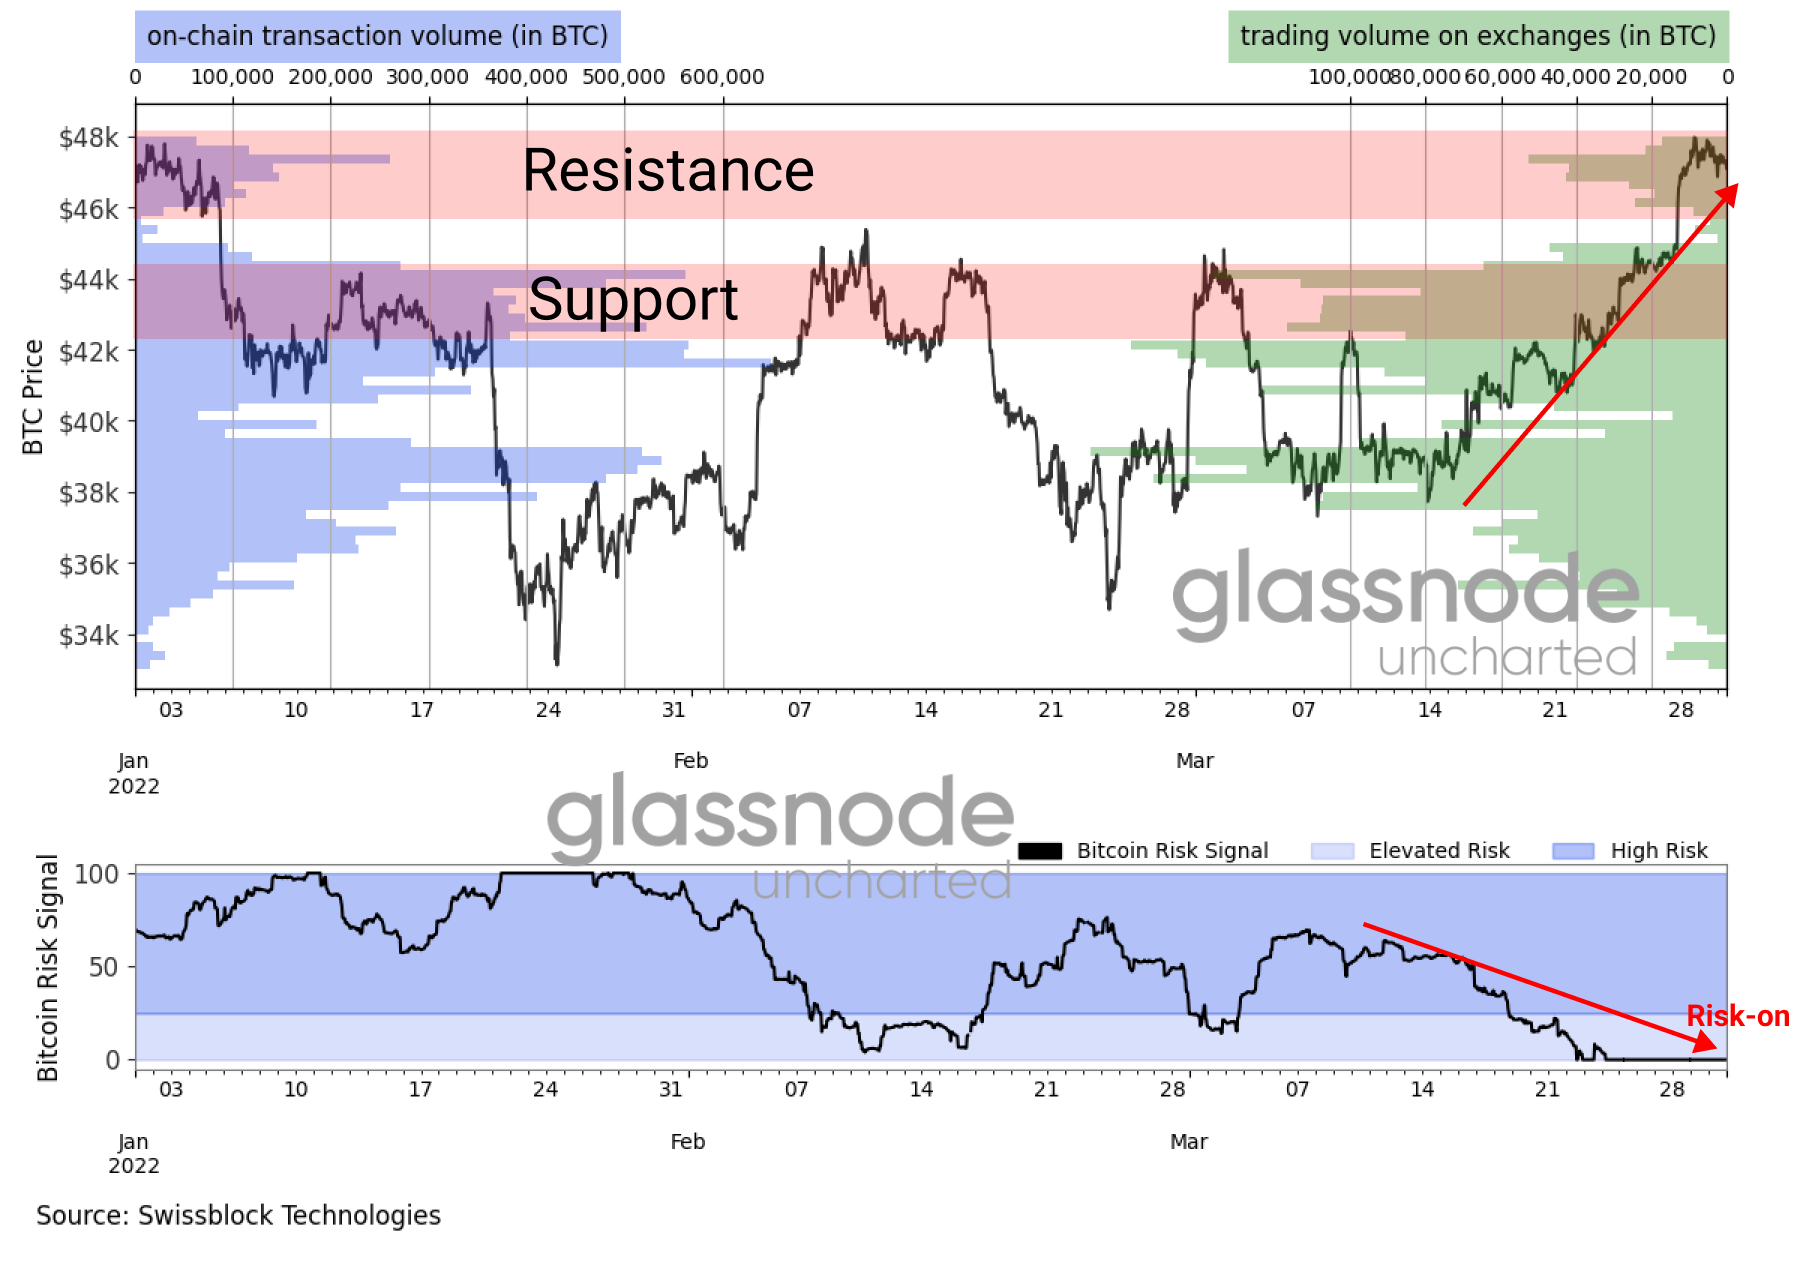
Bitcoin broke out of the $42-$45k trading channel and makes way for the $48k resistance level.
Institutional investors poured capital into bitcoin, ethereum, and altcoins despite the fragile macro environment.
Ethereum and altcoins gain momentum as Swissblock’s Altcoin Cycle Signal shifts into an altcoin regime.
Derivative players position themselves on the long side.
Demand for physical bitcoin strengthened fundamentals and mitigated the risk of a correction.
Swissblock Technology’s proprietary signals provide insights for near-term trading.
If you're interested in receiving frequent updates of our structural signals with an explanation of how to incorporate the said signals in your trading framework. Sign up for the waitlist here:
Bitcoin kicked off the recovery in cryptos
Macro-dynamics stayed their course since Uncharted #11: War keeps drumming on in Eastern Europe, and inflation remains a chief concern among companies and consumers in Western nations. Notwithstanding, for the time being, markets have adapted to this new dynamic, with the S&P 500 returning around 5% since our last publication on March 17th. With this backdrop, bitcoin finally broke out of its tightening trading channel we labeled as unsustainable in Uncharted #11 and subsequently converted the $45k resistance level into support.
To put the recent move into perspective, bitcoin and US equities outperformed safe havens since the FOMC meeting on March 16, with bitcoin leading the charge. However, US bonds and gold reverted while bitcoin traded sideways and equities dropped.
Figure 1: Risk-on vs risk-off performance

Focusing on bitcoin, the risk of an abrupt retrace subsided (Figure 2, bottom graph). Bullish sentiment reignited as bitcoin’s price made its way steadily towards $47k and held the level throughout the slight drop in equities.
Figure 2: Bitcoin’s trading channel ($45-$48k) and risk
As a consequence, the correlation to US equities increased, yet quickly reverted to late 2020 levels, which led to bitcoin’s run to $60k in May 2021 (Figure 3, red areas).
Figure 3: Correlation to US equities back at Q4 2020 levels
We should remain cautious as the macro environment continues to drive crypto investor behavior: Following hawkish remarks made by the Fed, investor sentiment dropped. Despite the year-to-date inflows into US equities (Figure 4, right graph red area), analyzed in Uncharted #11, we saw the first outflows (-$14 billion) since late Q3 2021 last week (Figure 4, left graph red area). At the same time, the dimmer confidence drove nearly $2 billion into US fixed-income securities.
Figure 4: Capital flowing from US equities into US fixed-income
The disregard for excess risk in traditional markets was underpinned by the outflows from high yield bonds and mid and small-cap ETFs and the inflows into gold and bonds ETFs (Figure 5). Following the Fed’s intention to let expiring bonds on its balance sheet roll off.
Figure 5: Investors shedding riskier asset classes
On the other hand, institutional capital flowed into bitcoin last week as the price bottomed in early March and made its way to $45k. Grayscale’s Bitcoin Trust saw two significant inflows, and the Purpose Bitcoin ETF had recurrent capital inflows (Figure 6, red areas).
Figure 6: Institutional investors buy bitcoin exposure

The demand for bitcoin in the stock market, as an alternative risk-on investment, caused the Grayscale discount to break its downward trend (Figure 7, red area), as it did in mid-2021. The GBTC discount explains the supply and demand in the stock market. A lack of demand would have pushed the discount below -40%, as an appreciation of bitcoin price on its own, is a driver of a widening discount.
Figure 7: Demand for bitcoin in the stock market picks up

Essentially, the GBTC discount represents the difference between the value of its holdings (BTC) and the market’s valuation of the shares (NAV > market value).
We see the potential of a sizable crypto-wide move forthcoming since institutional demand for crypto spread to other assets in the space other than bitcoin. Last week $193 million flowed into crypto (Figure 8), with bitcoin leading the way, followed by Solana ($87 million) and ethereum ($10 million). As we explained in the Uncharted: Special Edition, bitcoin is the trend driver, but once the trend is set, investors divest into riskier altcoins driving the crypto market as a whole.
Figure 8: Inflowing capital spreading to altcoins

Looking back to the time since 2021, we can see a trend of bitcoin losing its position as the key driver behind the crypto space, especially when comparing the performance between bitcoin, ethereum, and the top 20 traded coins. Notice how the ETH and top 20 traded coins indices fluctuate together with ETH in the lead (Figure 9, black and gray lines).
Figure 9: Ethereum, the new benchmark
Ethereum’s bullish development
Ethereum has come back to the forefront, as news of a successful merge on the Kiln testnet made the estimated June merge (meaning the transition to proof of stake) much more realistic. This transition, if successful, will make ethereum much more attractive to institutional investors following ESG mandates; it will also lead to a massively reduced supply as ETH will turn into a deflationary asset.
Keep reading with a 7-day free trial
Subscribe to Swissblock Insights to keep reading this post and get 7 days of free access to the full post archives.