


The Double-Edged Sword
Tension continues to grip markets amid a trade war with an uncertain outcome and a U.S. Fed, led by Jerome Powell, that refuses to yield to Trump’s pressure. It’s a battle on two fronts, gradually spilling into the area that hurts the most: the economy. It’s like watching a slow-motion explosion, with debris accelerating towards us.
U.S. indices have experienced some very dark days, and many indicators have fallen to crisis levels, similar to March 2020 during the COVID disruption or late 2008 during the financial crisis. Yet, monthly index closes show signs of hope, with a recovery that could lay the groundwork for a new bull run.
Despite the prevailing sentiment, sharp investors recognize this environment as an opportunity above all. Bullish signals — though scarce — are emerging from unexpected places. One of them is Bitcoin, which has not only resisted pressure during the worst market days but has also started to form a bottom and is now entering a recovery phase.
Even more importantly, Bitcoin has led the way for the broader market. Of course, systemic risk remains — exponentially heightened by the Trump-Bessent duo's risky bets. It’s as if they attempted to dangle a sword over their adversaries' heads, without realizing it was a double-edged sword slowly starting to bleed them instead.

Of Risk and Sentiment.
Sentiment within Bitcoin and the broader crypto ecosystem has caught its first breath of greed after weeks dominated by fear. It’s understandable — the surrounding environment has been complex, volatile, and challenging.

Naturally, everyone turns bullish when prices rise. A positive sign, however, is that we are not seeing an extreme shift or mindless jumps into euphoria. There's still an underlying fear, and until disruptions from the trade war dissipate and negotiations materialize, that fear and caution will remain.
Sentiment is often capricious and volatile, so a one-sided market reading is dangerous. A more objective and colder lens is market risk itself. The indicator stayed in a high-risk regime since the last week of February, but crucially, it never hit its maximum (100). Instead, after peaking, it consistently registered lower highs.

This kept us confident that a price collapse was unlikely (also confirmed by other indicators). Even though the indicator remained above 25 (high-risk territory), it stayed stable.
This stabilization is also visible in the Risk Oscillator. Although still stabilizing, April showed even lower peaks, alongside a declining Market Risk Indicator. As long as the Risk Oscillator holds around 0.5, it sets the stage for a healthier price structure to continue the bullish path.

If we look deeper into Key Risk Elements, intraday volatility has decreased significantly, but interday volatility has picked up. This implies two things: price momentum has stalled, and profit-taking (or small-loss exits) has intensified among those who bought around current prices — typically retail or short-term holders.
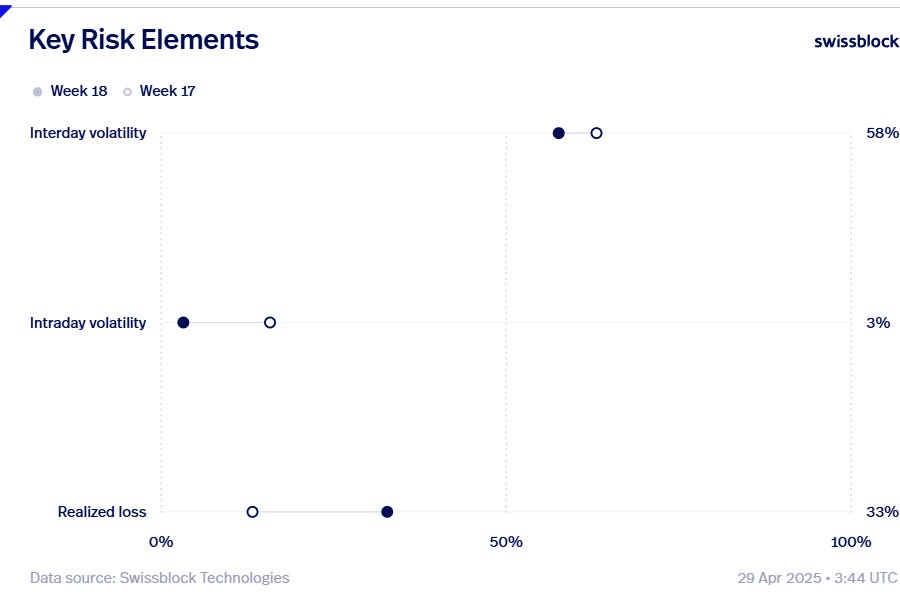
This is reflected in the data: although loss-selling is still low, it has risen compared to last week.
Buyers who entered around $94K–$95K and beyond — the mid-range zone we've been consolidating since December — are showing little trust in price momentum and are opting to exit either with a small gain or limited loss. This naturally slows price momentum, but the good news is that as selling pressure fades, the indicator can regain strength.

Fundamentals are on our Side.
On the fundamental side, Bitcoin is showing notable strength. The BFI briefly shifted into the positive quadrant before returning to the neutral channel. What’s key here is that throughout February and March — during the height of bearish pressure — the indicator never dipped into negative territory. Had it done so and remained there without recovering, it would’ve been more than enough reason to revise our outlook on Bitcoin to bearish.

But that wasn’t the case. Mid-February marked the bottom in liquidity, and since then, we've seen a steady inflow back into the system, with natural oscillations along the way. As price began to recover, additional liquidity followed — a key distinction. The initial wave of liquidity at the lows helped establish a price floor. The recent inflow, however, is reinforcing the price in a bullish direction.

Nevertheless, we’ve seen a notable decrease in the number of participants. We attribute this to short-term holders exiting — those who, as we previously noted, don’t trust the sustainability of the recent pump and are either offloading or lightening their exposure to regain liquidity.
As we’ll see next, the coming phase in Bitcoin’s price development will be largely psychological — fertile ground for retail traps.
Weekly Playbook.
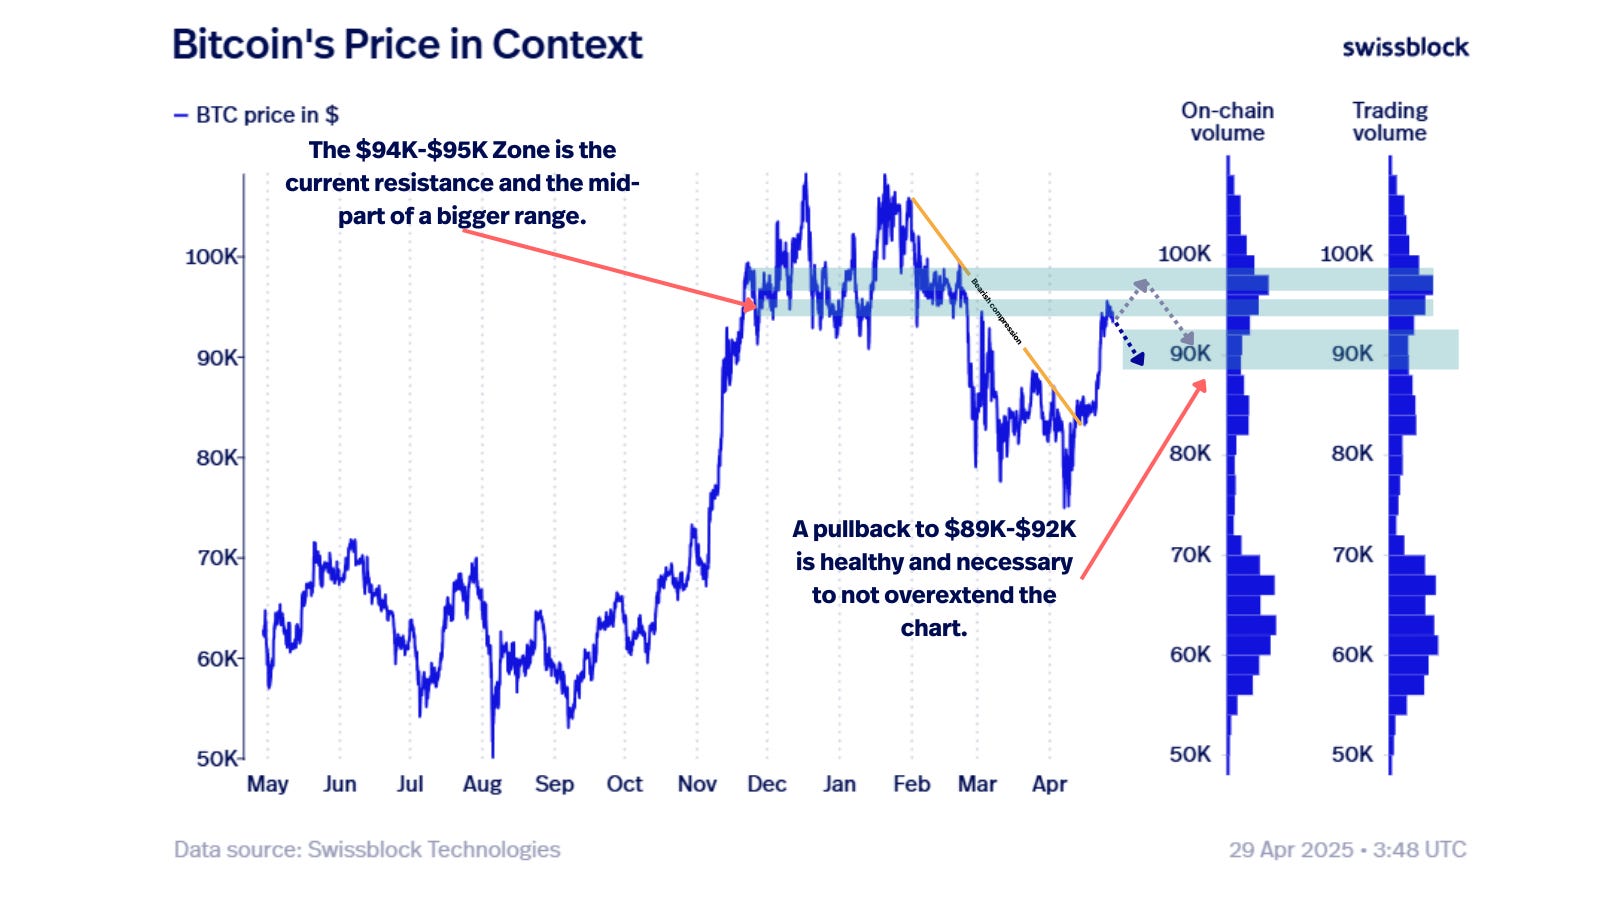
Bitcoin has encountered significant resistance in the $94K–$95K area. Looking back at previous projections, this zone has repeatedly been a congestion point. Even without indicators, we can identify this as the midpoint of an accumulation range, and therefore, a natural area of exit for short-term holders. We could label it a sort of point of control.
What’s next for Bitcoin?
That’s why a basic principle of range formation is to avoid entering in the middle of the range — and certainly not at the top. The upper boundary is also well-defined: $97K–$98.5K. Historically, this area has acted as a transition zone toward $100K, with price often getting rejected both on the way up and down.
This is a psychological battle. If price breaks above $94K–$95K, breakout buyers will likely get trapped around $97K–$98.5K — right before facing the major challenge: the $100K level. How tempting it would be to buy back in around that area after selling lower, just as price threatens to break six figures. Would short-term holders chase it again? If FOMO kicks in, absolutely.

And that’s precisely the trap. Which is why buying the breakout isn’t advisable. There are two better options: wait for a pullback toward the $89K–$92K zone of interest, or apply a DCA strategy during minor dips.
One problem with rapid price increases is overextension. And if price doesn’t correct gradually, the downside can be just as sharp as the upside. That’s why a retracement to the $89K–$92K range would be both healthy and necessary for the uptrend to remain sustainable.
We’ll also likely see strong interest from institutional players at that level. If retail avoids the trap, and the weak hands stay sidelined, we could witness a powerful synchronization between smart money and retail — enough to push Bitcoin toward $100K with conviction and volume.
Key Takeaways.
Markets are under dual pressure: a prolonged trade war and a Federal Reserve unwilling to accommodate political demands. Major U.S. indices hit crisis-level readings, though monthly closes hint at potential recovery and a new bull run.
Bitcoin has shown resilience during the worst periods, signaling bottom formation and the start of a recovery — leading broader market sentiment.
Bitcoin sentiment has shifted from fear to cautious greed — a healthy change that avoids euphoric excess.
Market risk peaked in February but never hit extremes; lower highs in risk indicators signal decreasing danger. Intraday volatility dropped, but interday volatility rose — a sign of stalled momentum and exit activity by short-term holders.
The Bitcoin Fundamentals Index (BFI) never turned negative, even during high bearish pressure, supporting the long-term bullish thesis. Liquidity bottomed mid-February and has since flowed back in, first stabilizing price, now reinforcing the uptrend.
Participant count has declined, likely due to short-term holders exiting amid disbelief in the rally’s sustainability.
Bitcoin faces key resistance at $94K–$95K, historically a congestion zone and natural exit point for short-term holders. Upper resistance lies at $97K–$98.5K, just before the major psychological milestone of $100K. A breakout through $94K–$95K could become a bull trap, as FOMO buyers may get stuck below $100K.
Avoid chasing breakouts near mid or upper range zones. Two preferred tactics:
Wait for a pullback to the $89K–$92K accumulation zone.
Use DCA (Dollar-Cost Averaging) during minor dips.
A healthy correction would provide a stronger base for a sustainable move toward $100K. Institutional interest is likely to re-emerge on dips, potentially aligning with patient retail to push price higher.