


Cross Asset Compass 0
08 March 2023


Bitcoin has pulled back somewhat this week. This has been expected, as DXY has been moving higher in the bounce which is expected to top out in the 106-107.8 area. This may cause more pullback in bitcoin before it takes off in the next leg higher.
The move will likely not begin before the top in DXY is in – but when it takes off, it should take bitcoin to ~35k before 46k and higher. Bitcoin is expected to fly high as DXY moves lower into Mid-2023.


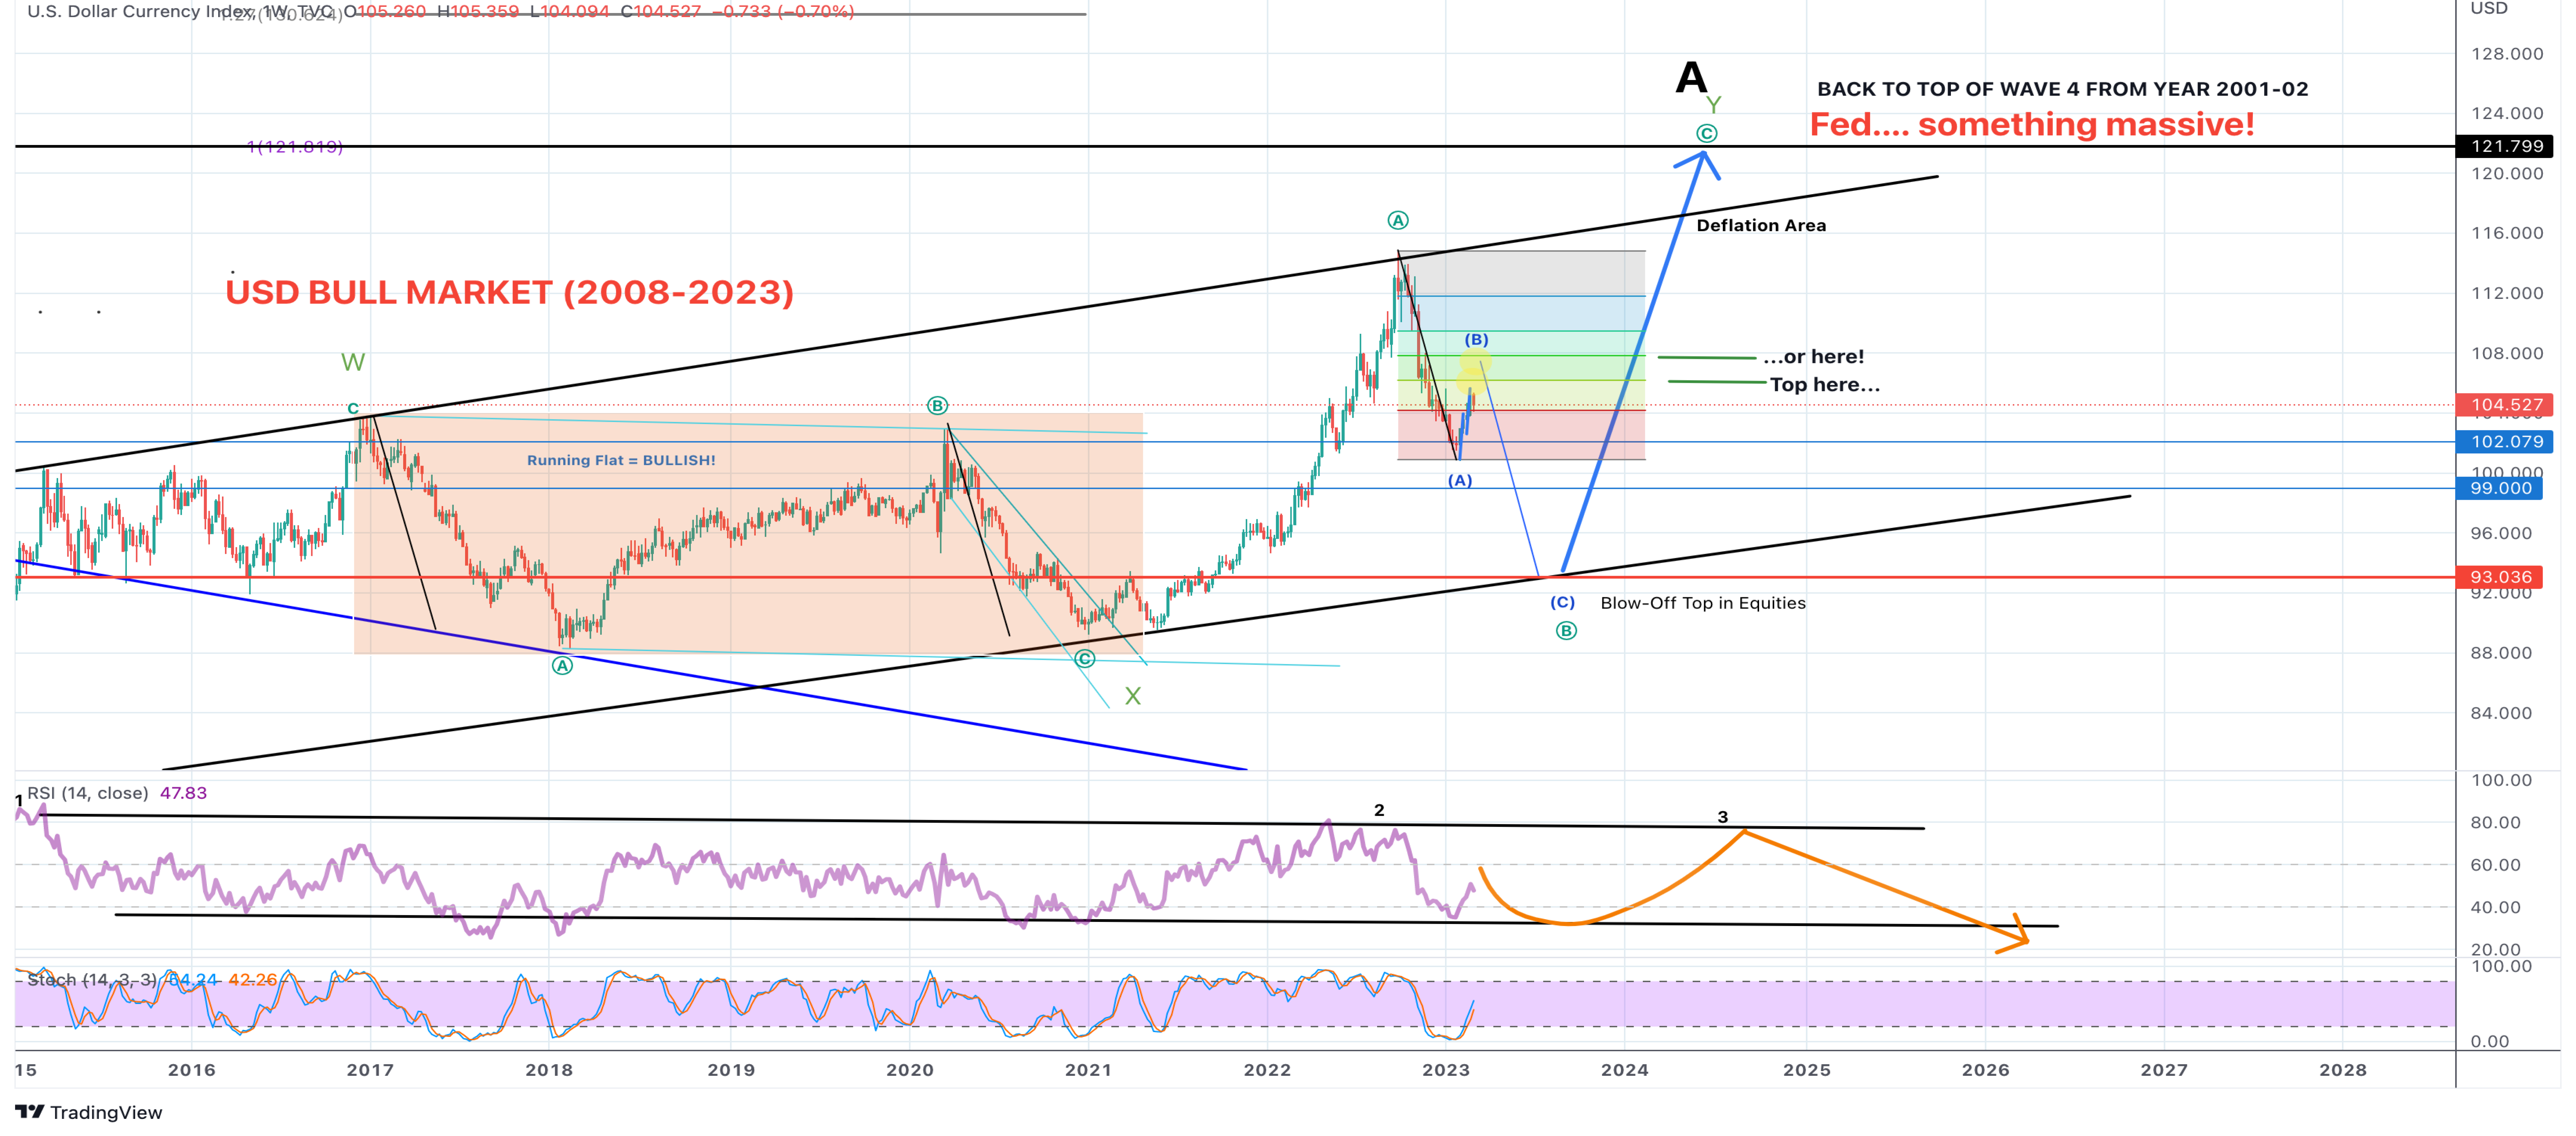
Bounce in the DXY (the dollar index) has reached 105.3 and pulled back just slightly from that level this week. The bounce may likely continue to the 106-107.8 area before the DXY takes a larger tumble as wave c of wave B develops down towards the 91-93 area.
Long term the chart suggests that we see 120 and return to the top from 2001-02 before a major top and reversal for the coming many years.

SP500 bounced off the Weekly 50 SMA and off the trendline. This is a successful back-test and a strong indication of the ongoing Bull Market. Momentum on the weekly chart is above 50 and moving higher. MACD is Bullish and moving higher.
All in all, this is a Bullish setup and the next level to be reached is ~4360 before another short consolidation. Following that we should see 4725 before a larger pullback. Blow-Off Top is still expected to reach ~6100 sometime later in 2023.


US 10YR has moved higher in the last few weeks. However, this week we saw a strong pullback in Friday’s trading. Could have marked a top.
Rates lag the business cycle – hence we need to have seen the top in job numbers etc. (coincident indicators) before we convincingly can identify the top in rates. Technically, the setup looks like 2013 and 2018. Negative divergence leads to price. This time will not be different. It is a matter of time before rates and US 10YR roll over and start a long decline toward new lows.

3rd rule of EW by BabyPips:
Rule Number #3: Wave 4 can NEVER cross in the same price area as Wave 1
That invalidades The first chart.