


BTC Broke the Range
Crypto Compass 100


“Champions keep playing until they get it right.” — Billie Jean King
🇨🇭 Join our Swissblock Telegram Group! Get daily updates, in-house content, and technical analysis on crypto & macroeconomics. Tap into a hub of knowledge and insights. Stay ahead with Swissblock. Sign up now! 🚀

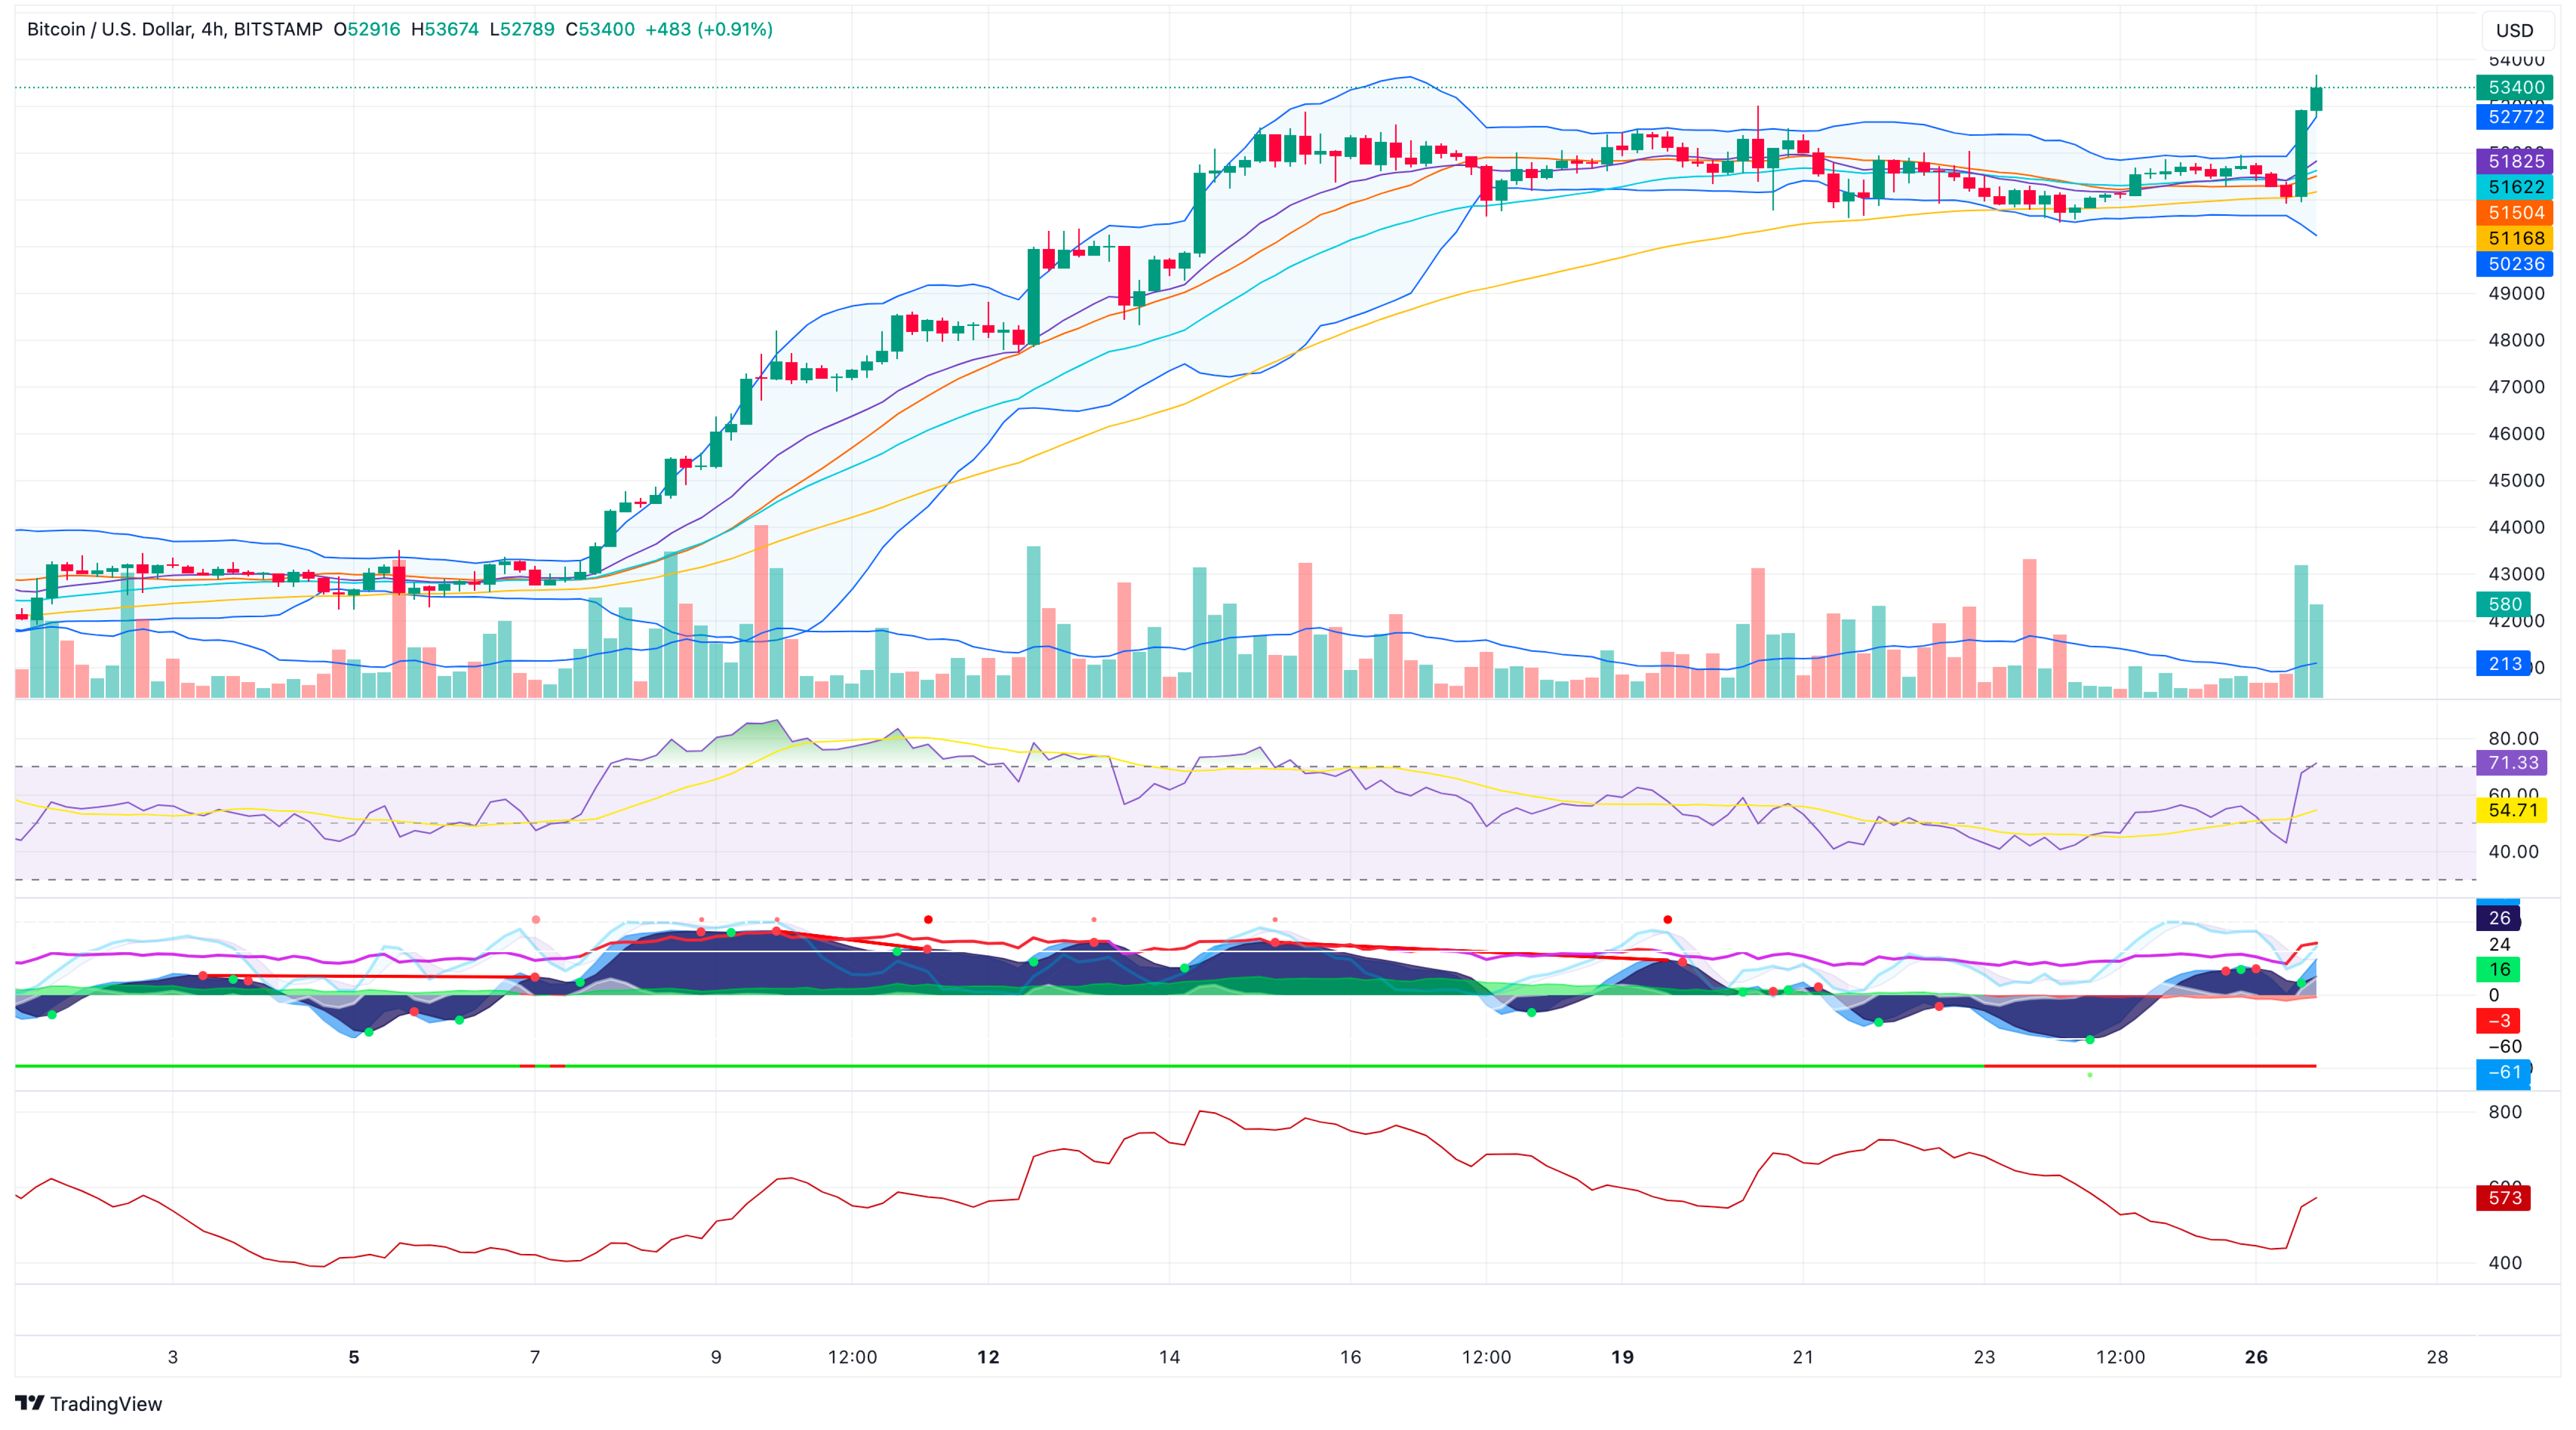
BTC witnessed a sudden surge, catapulting to a new 26-month high of over $53.5k, after experiencing resistance around the $52k level during the weekend. This unexpected move came shortly after the asset had dipped to $51k, suggesting a continuation of consolidation at that level.
While the possibility of shorting BTC exists, the overall outlook remains bullish. This can be interpreted that long-term holders are being patient for higher prices. As a result, their lack of supply can drive the market higher in the coming months.

This week, all eyes on Wall Street are fixated on the impending release of the core Personal Consumption Expenditures (PCE) data report, a high-impact event on the U.S. economic calendar. As the Federal Reserve's preferred measure of inflation, this report has the potential to significantly influence market sentiment and trigger volatility across various asset classes.
Analysts anticipate the January core PCE data to reveal a 0.4% increase compared to the previous month, potentially leading to a slight decline in the annual inflation rate from 2.9% to 2.7%. While this forecast suggests a modest shift in the inflationary trajectory, caution against complacency, as unexpected outcomes akin to recent Consumer Price Index (CPI) and Producer Price Index (PPI) reports could disrupt market expectations and prompt rapid adjustments in price.


The daily chart analysis reveals an upward trend in BTC’s price trajectory, marked by consecutive higher peaks and troughs, with a notable resistance level observed near $53.015K. This pattern indicates bullish momentum in the market. Additionally, the high open interest in BTC futures contracts indicates growing participation from traders, reflecting increased demand for BTC.
Keep reading with a 7-day free trial
Subscribe to Swissblock Insights to keep reading this post and get 7 days of free access to the full post archives.