


Bitcoin's Blow-Off Top Part 1: The Run to $35k
Special Edition 03

Bitcoin is hovering around a round number, a psychological level so embedded in the roots of the market’s psychology, that a $1k move within expectations shook the market. $30k is within grabs, and this might be the last opportunity to buy bitcoin below the said level for some time to come. Bitcoin is up 76% year-to-date, and there is more to come. This is the beginning of a strong move into the Summer, but no asset moves in a straight line. The Special Edition will deep dive into the different indicators that support the first part of our long-term overview. This is the road to $35k.
Let’s dig in!
Key Takeaways
Bitcoin is expected to follow an expanding diagonal pattern and reach a major top later this year, with technical indicators pointing to higher levels.
The incoming liquidity from central banks, along with cooling inflation, creates a favorable environment for risk assets like crypto and equities to rally.
The short-term pullbacks and bounces in the DXY and profit-taking are to be expected, but the overall trend is extremely bullish.
Rates and a weaker DXY are very bullish for equities, bitcoin, and crypto, with growth stocks ready to take off in a strong manner.
The fundamental economic perspective is supportive of a risk asset rally, which strengthens the bullish outlook for bitcoin and other assets into the Summer.
Bullish Price Structure
From an Elliot Wave perspective, bitcoin seems to be shaping up a major pattern, called expanding diagonal (figure 1). The pattern begins in December 2017 and should, as per the theory, conclude in a major top sometime later this year. The move is expected to follow an ABC pattern, which should unravel in late Spring or early Summer.

Technical indicators reinforce our hypothesis of a strong bull market in the making. The weekly RSI has crossed over 60, MACD is positive and moving higher, and there is a bullish crossover between the SMA50 and SMA200 (figure 2). These elements are characteristic of a bull market and point to higher levels.

When looking at bitcoin’s trends from different horizons, we can see that the long-term trend is extremely bullish (figure 3), and the faster trends will continue to push it higher despite the recent dip to $27.2k.

Remember that no bull market is safe from short-term pullbacks (figure 4), which may occur due to short-term bounces in the DXY and/or profit-taking. Bitcoin looks strong and ready to go higher into the Summer.

Liquidity, the Fuel to the Fire
The backbone of our thesis is the incoming liquidity as the Fed and other Central Banks from around the world are back at the liquidity pumps. And bitcoin is a credit-sensitive asset, which thrives on expanding liquidity (figure 5).

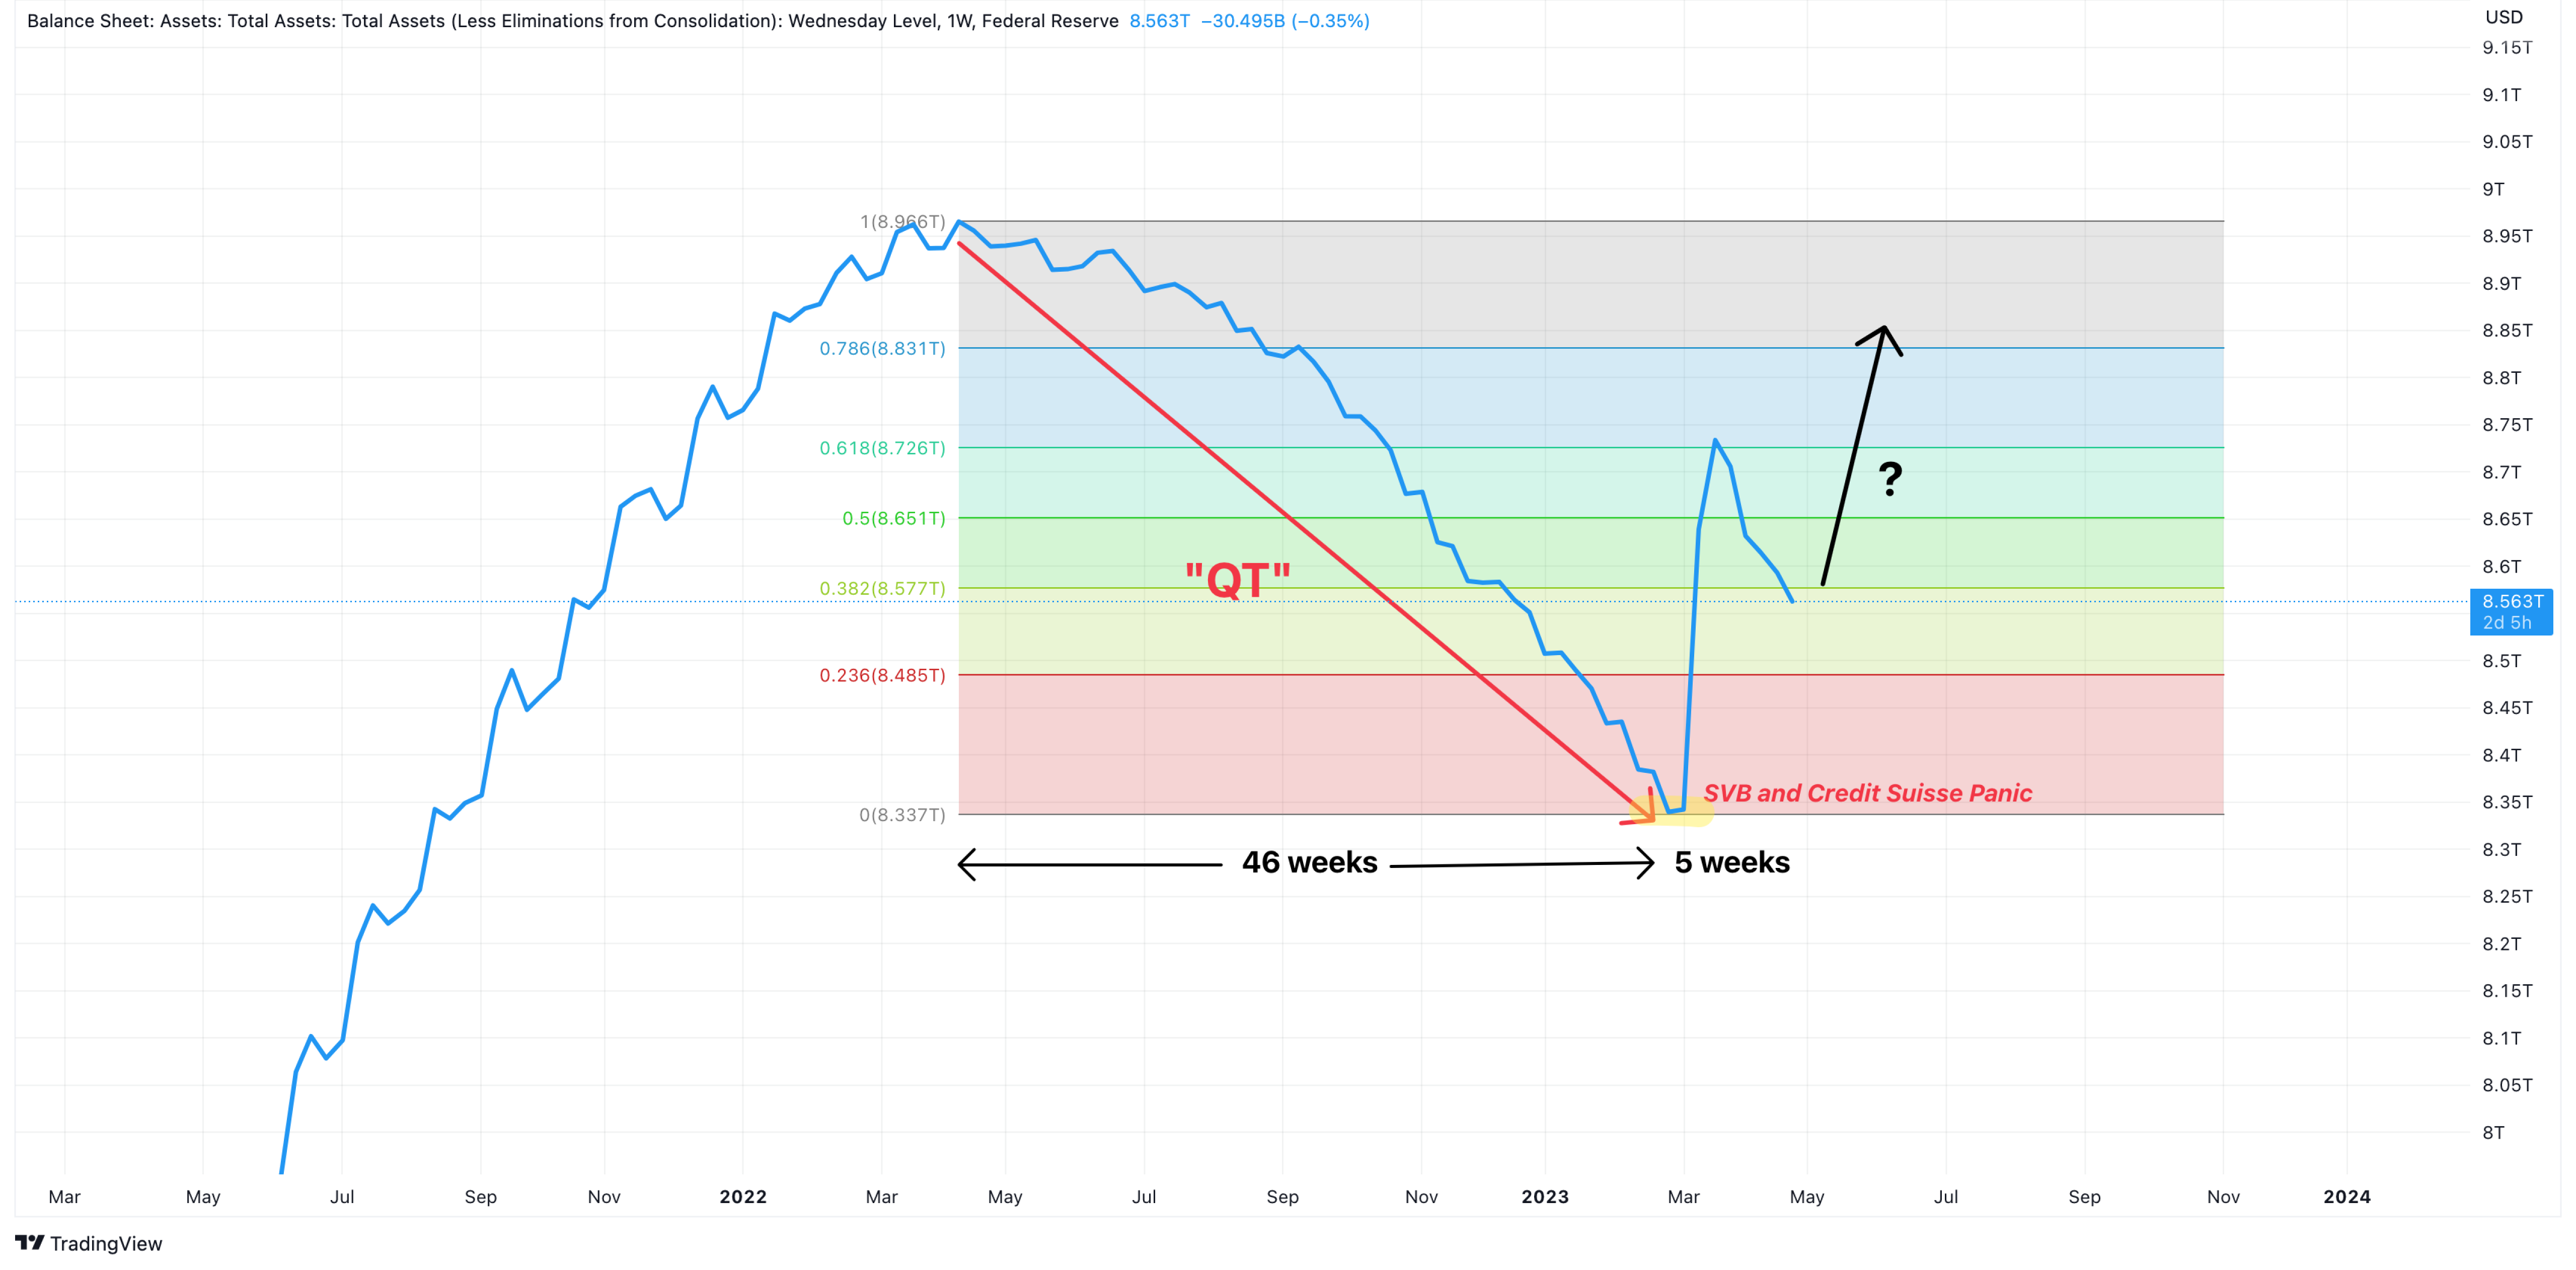
Coming out of the banking scare, caused by SVB some weeks ago, the Fed has been increasing its balance sheet again. Some contraction has been noted over the past couple of weeks (figure 6), but ~50% of last year’s QT has been undone in a matter of 4 - 5 weeks.
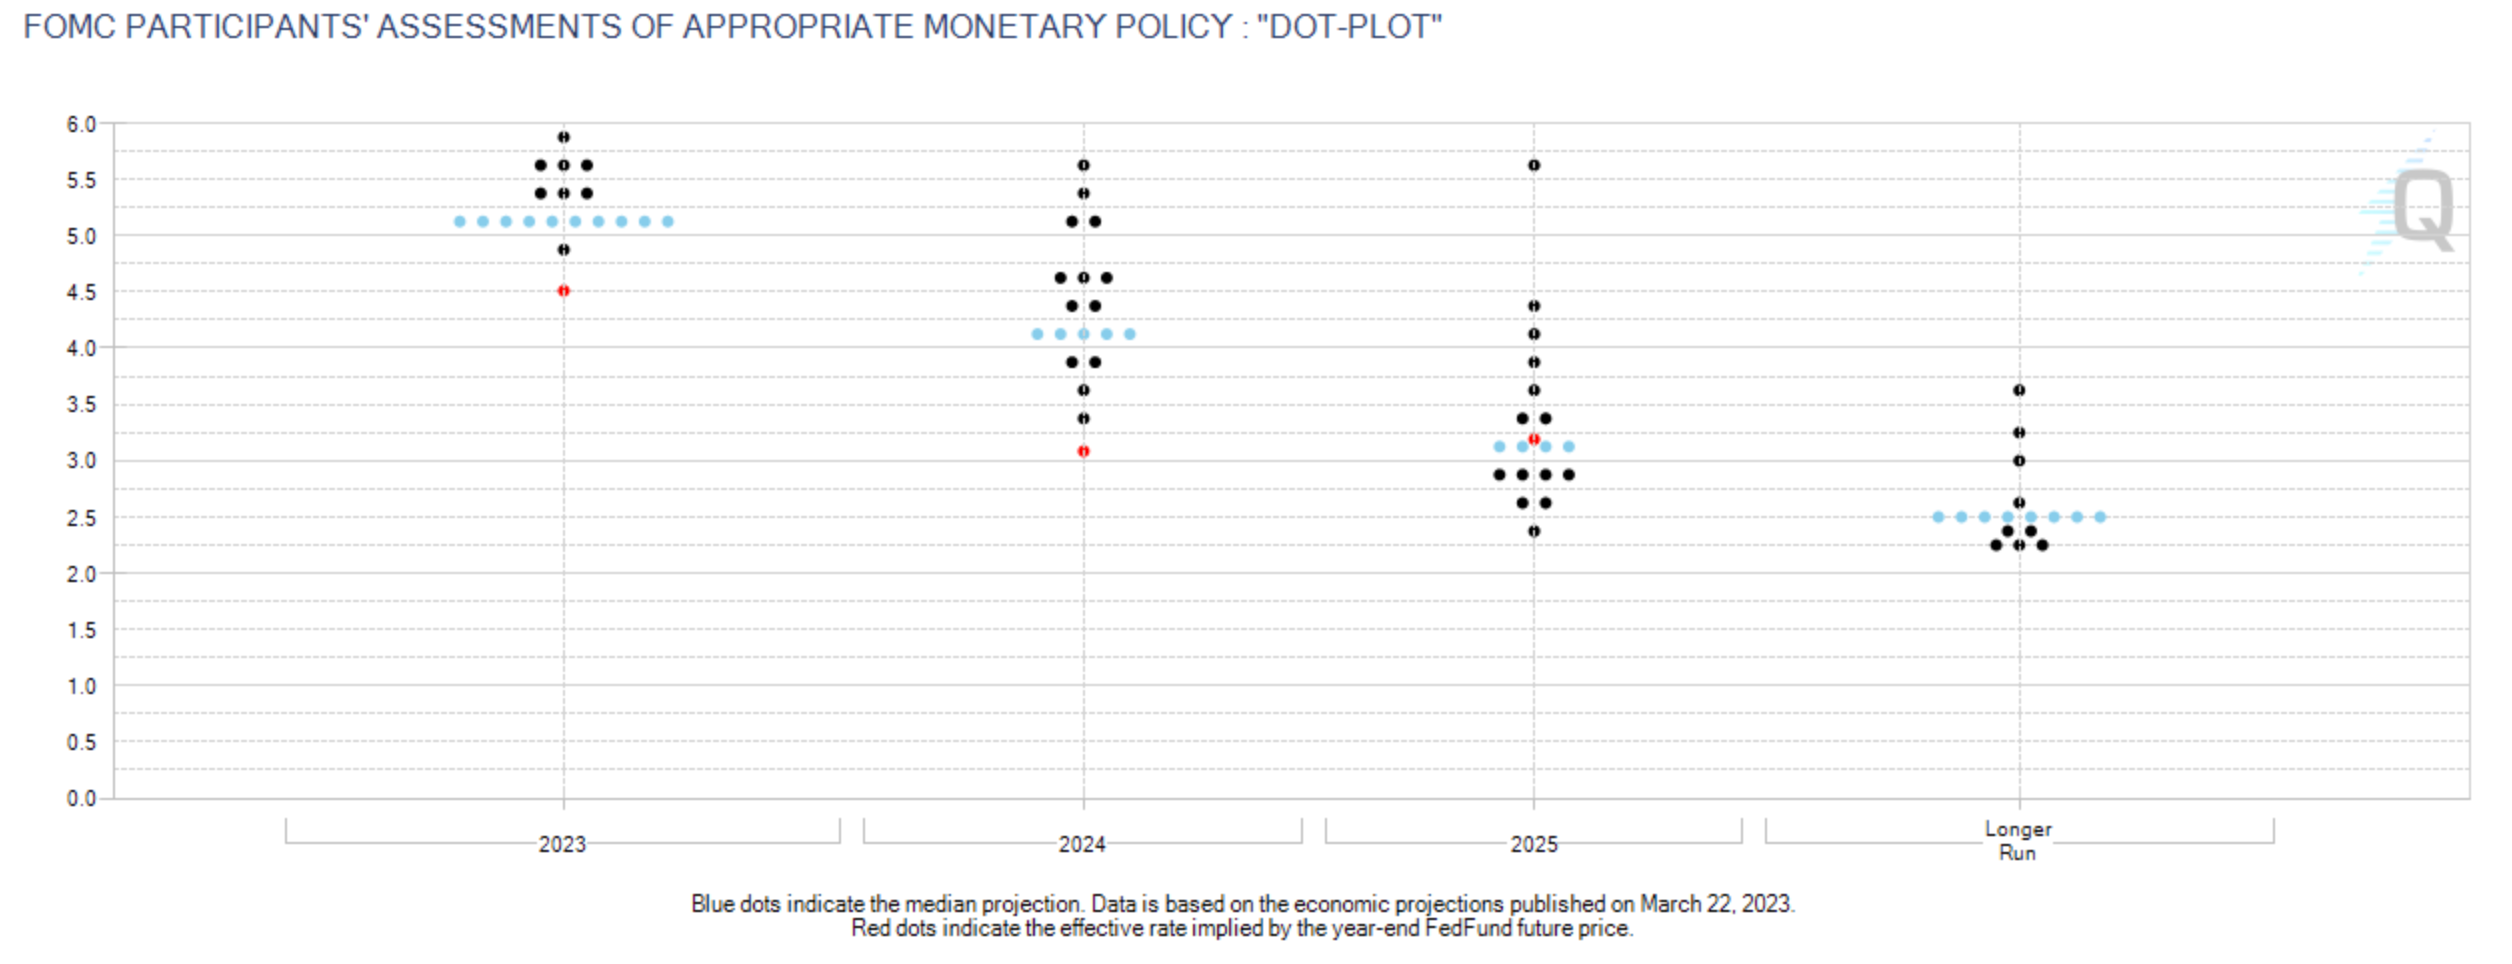
We expect more liquidity to be injected into markets as inflation has been coming down strongly. The Fed has communicated that the pause in rates is closing in, especially as we’re one 25bps hike from the consensus target rate for 2023 (5.125, figure 7). This will create support for bitcoin over the coming weeks and months into the Summer.
The Economy is Not in a Recession
The first thing to consider is we’re not in a recession, despite all you hear or read online, which combined with cooling inflation paves the way for risk assets like crypto and equities to rally. This is true as long as the economy stays above recessionary levels because one of the consequences of fighting inflation is slowing GDP growth.
Again, it’s not the case. Non-farm payrolls suggest that the economy is still growing (figure 8) - at a slower pace. The most recent labor data showed fewer initial claims than expected and a print below the 4-week average of claims.

In fact, it seems like the economy may be bouncing short-term here, which may be a consequence of the cooling inflation. The NY Empire State Manufacturing Index bounced to 10.80 last week (figure 9), suggesting things may not look as gloomy as some analysts want us to believe.

We have to acknowledge that some of the leading indicators have caved, signaling a coming recession - 6 to 9 months out - but the coincident and lagging indicators are afloat (figure 10). GDP came in lower than expected for Q1 2023, but it was still positive at 1.1%.
The Market, the Predominant Leading Indicator
Keep reading with a 7-day free trial
Subscribe to Swissblock Insights to keep reading this post and get 7 days of free access to the full post archives.